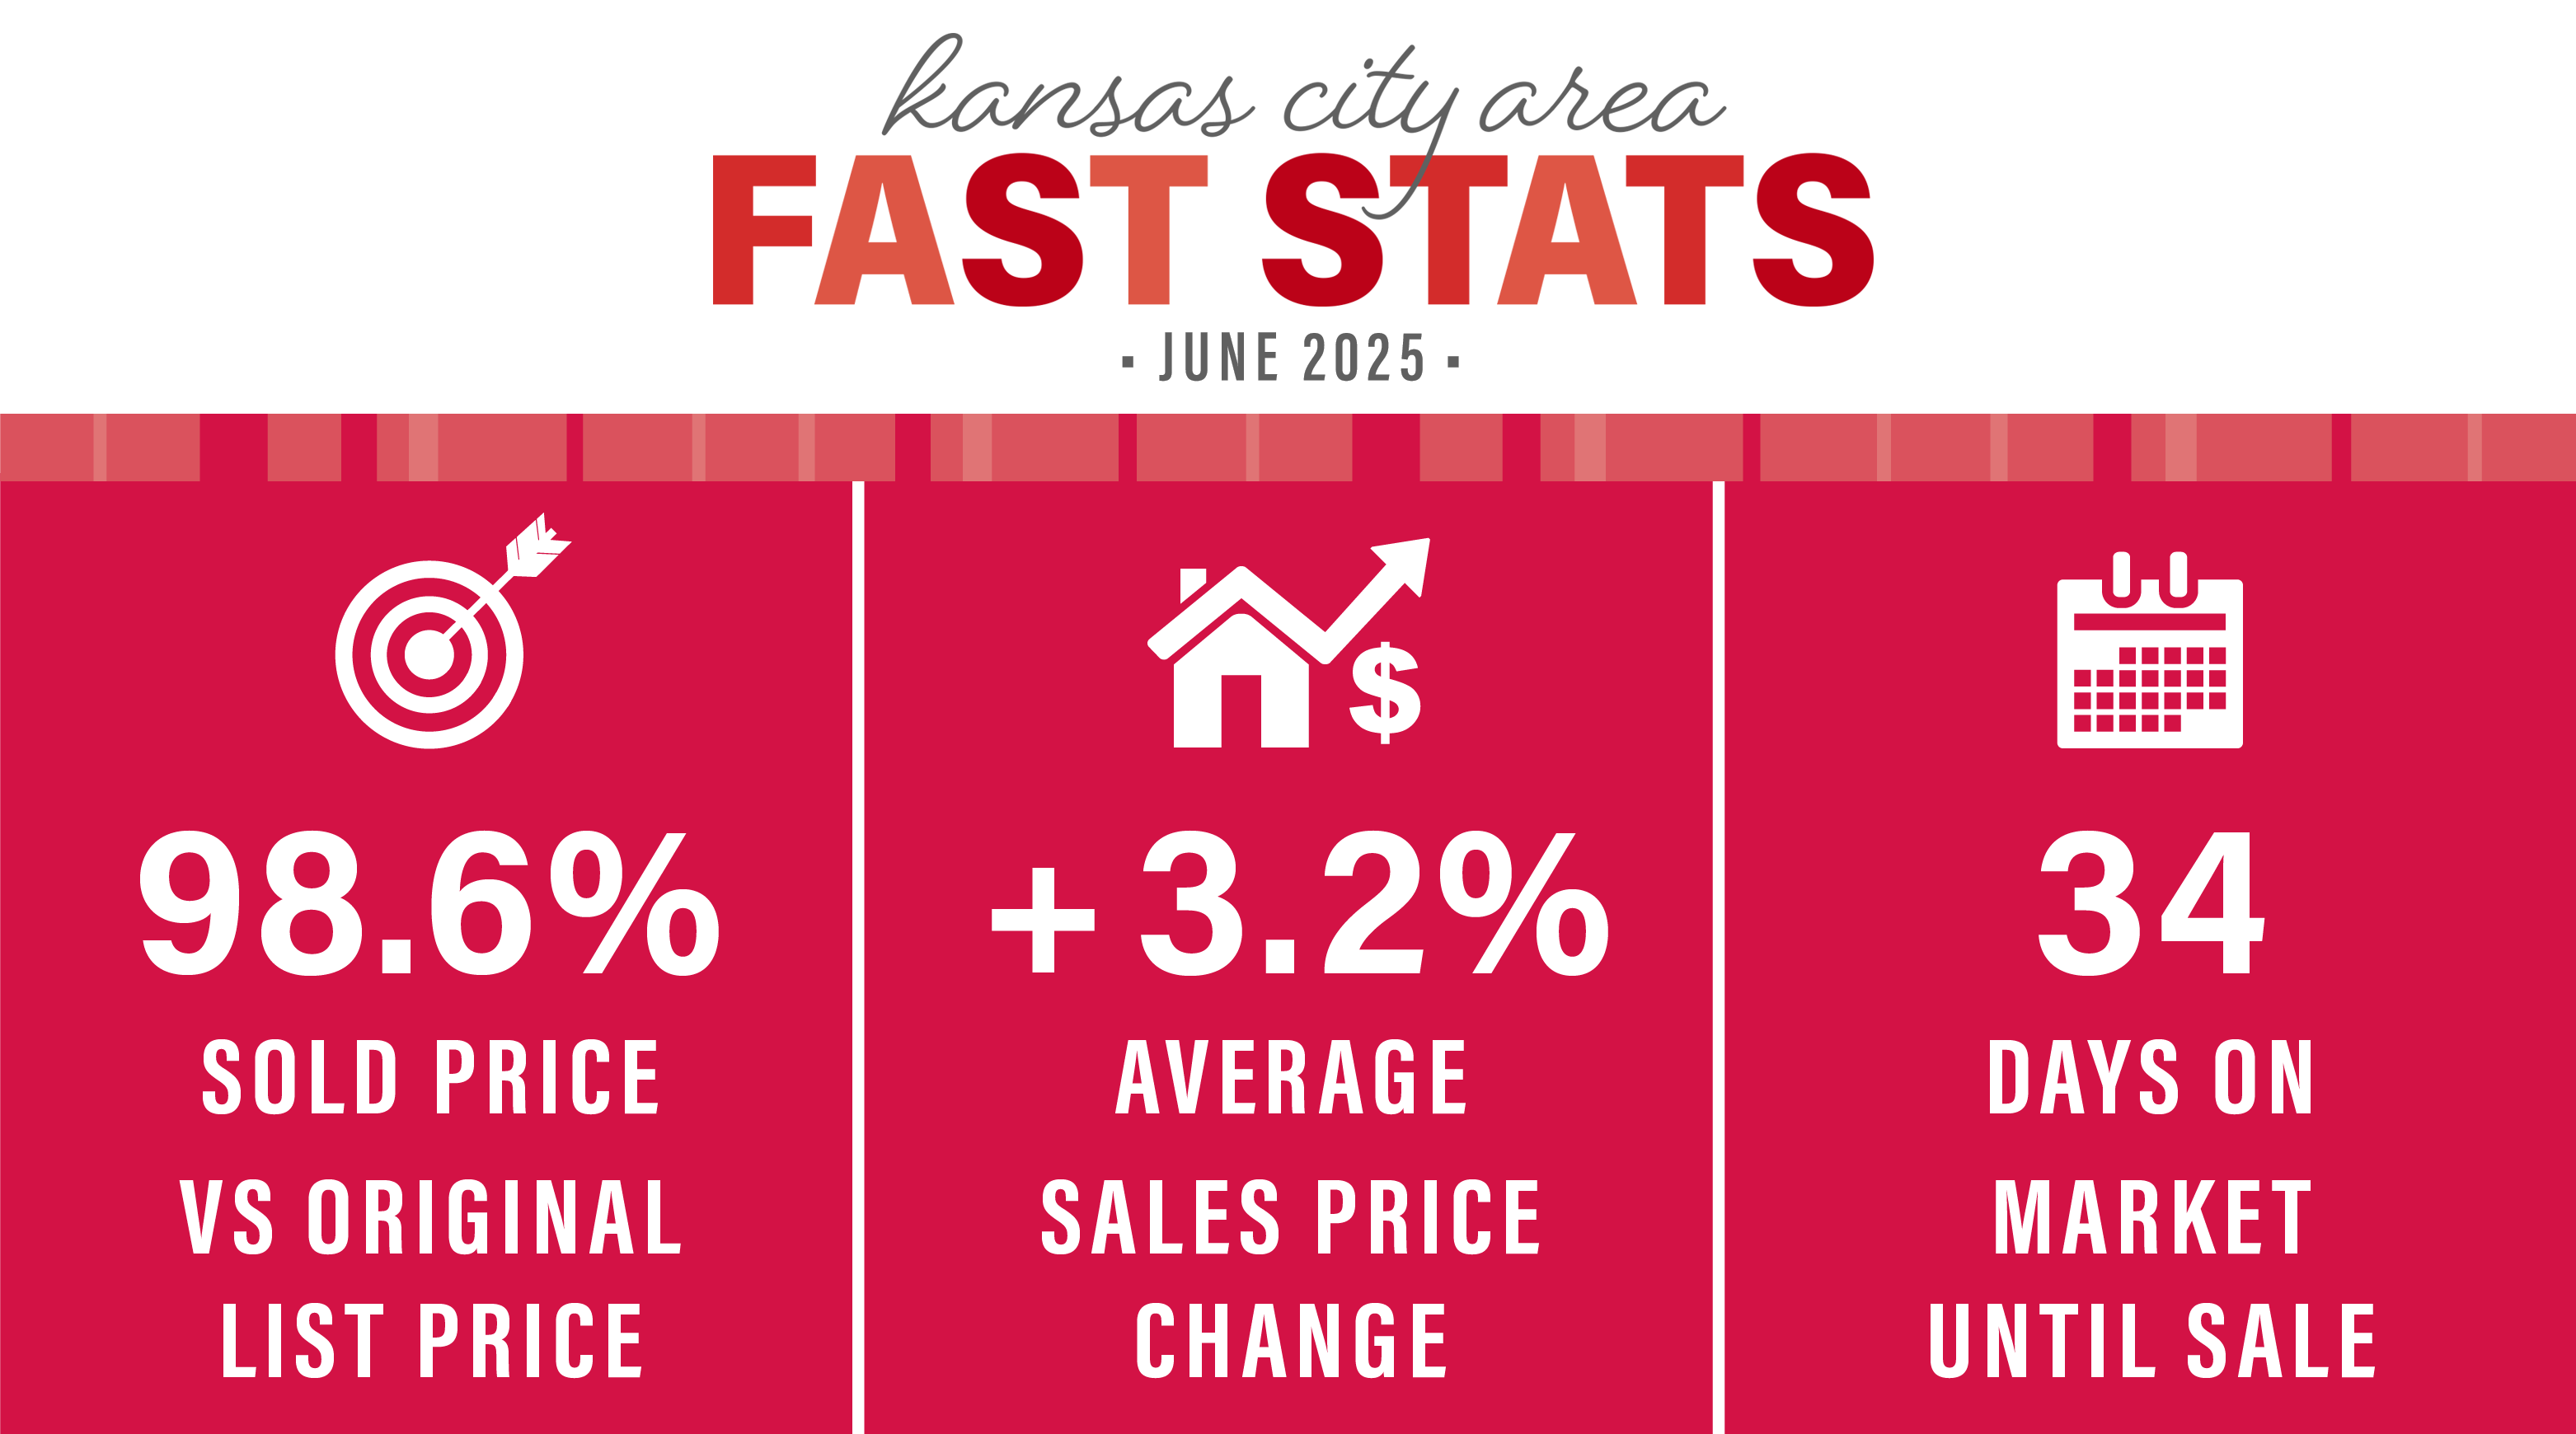
JUNE 2025 KANSAS CITY AREA MARKET UPDATE
Homes are selling for an average of 98.6% of the original list price. Days on the market is at 34 days. KC has a 2.6 months supply of homes on the market, which is 7,846 available houses.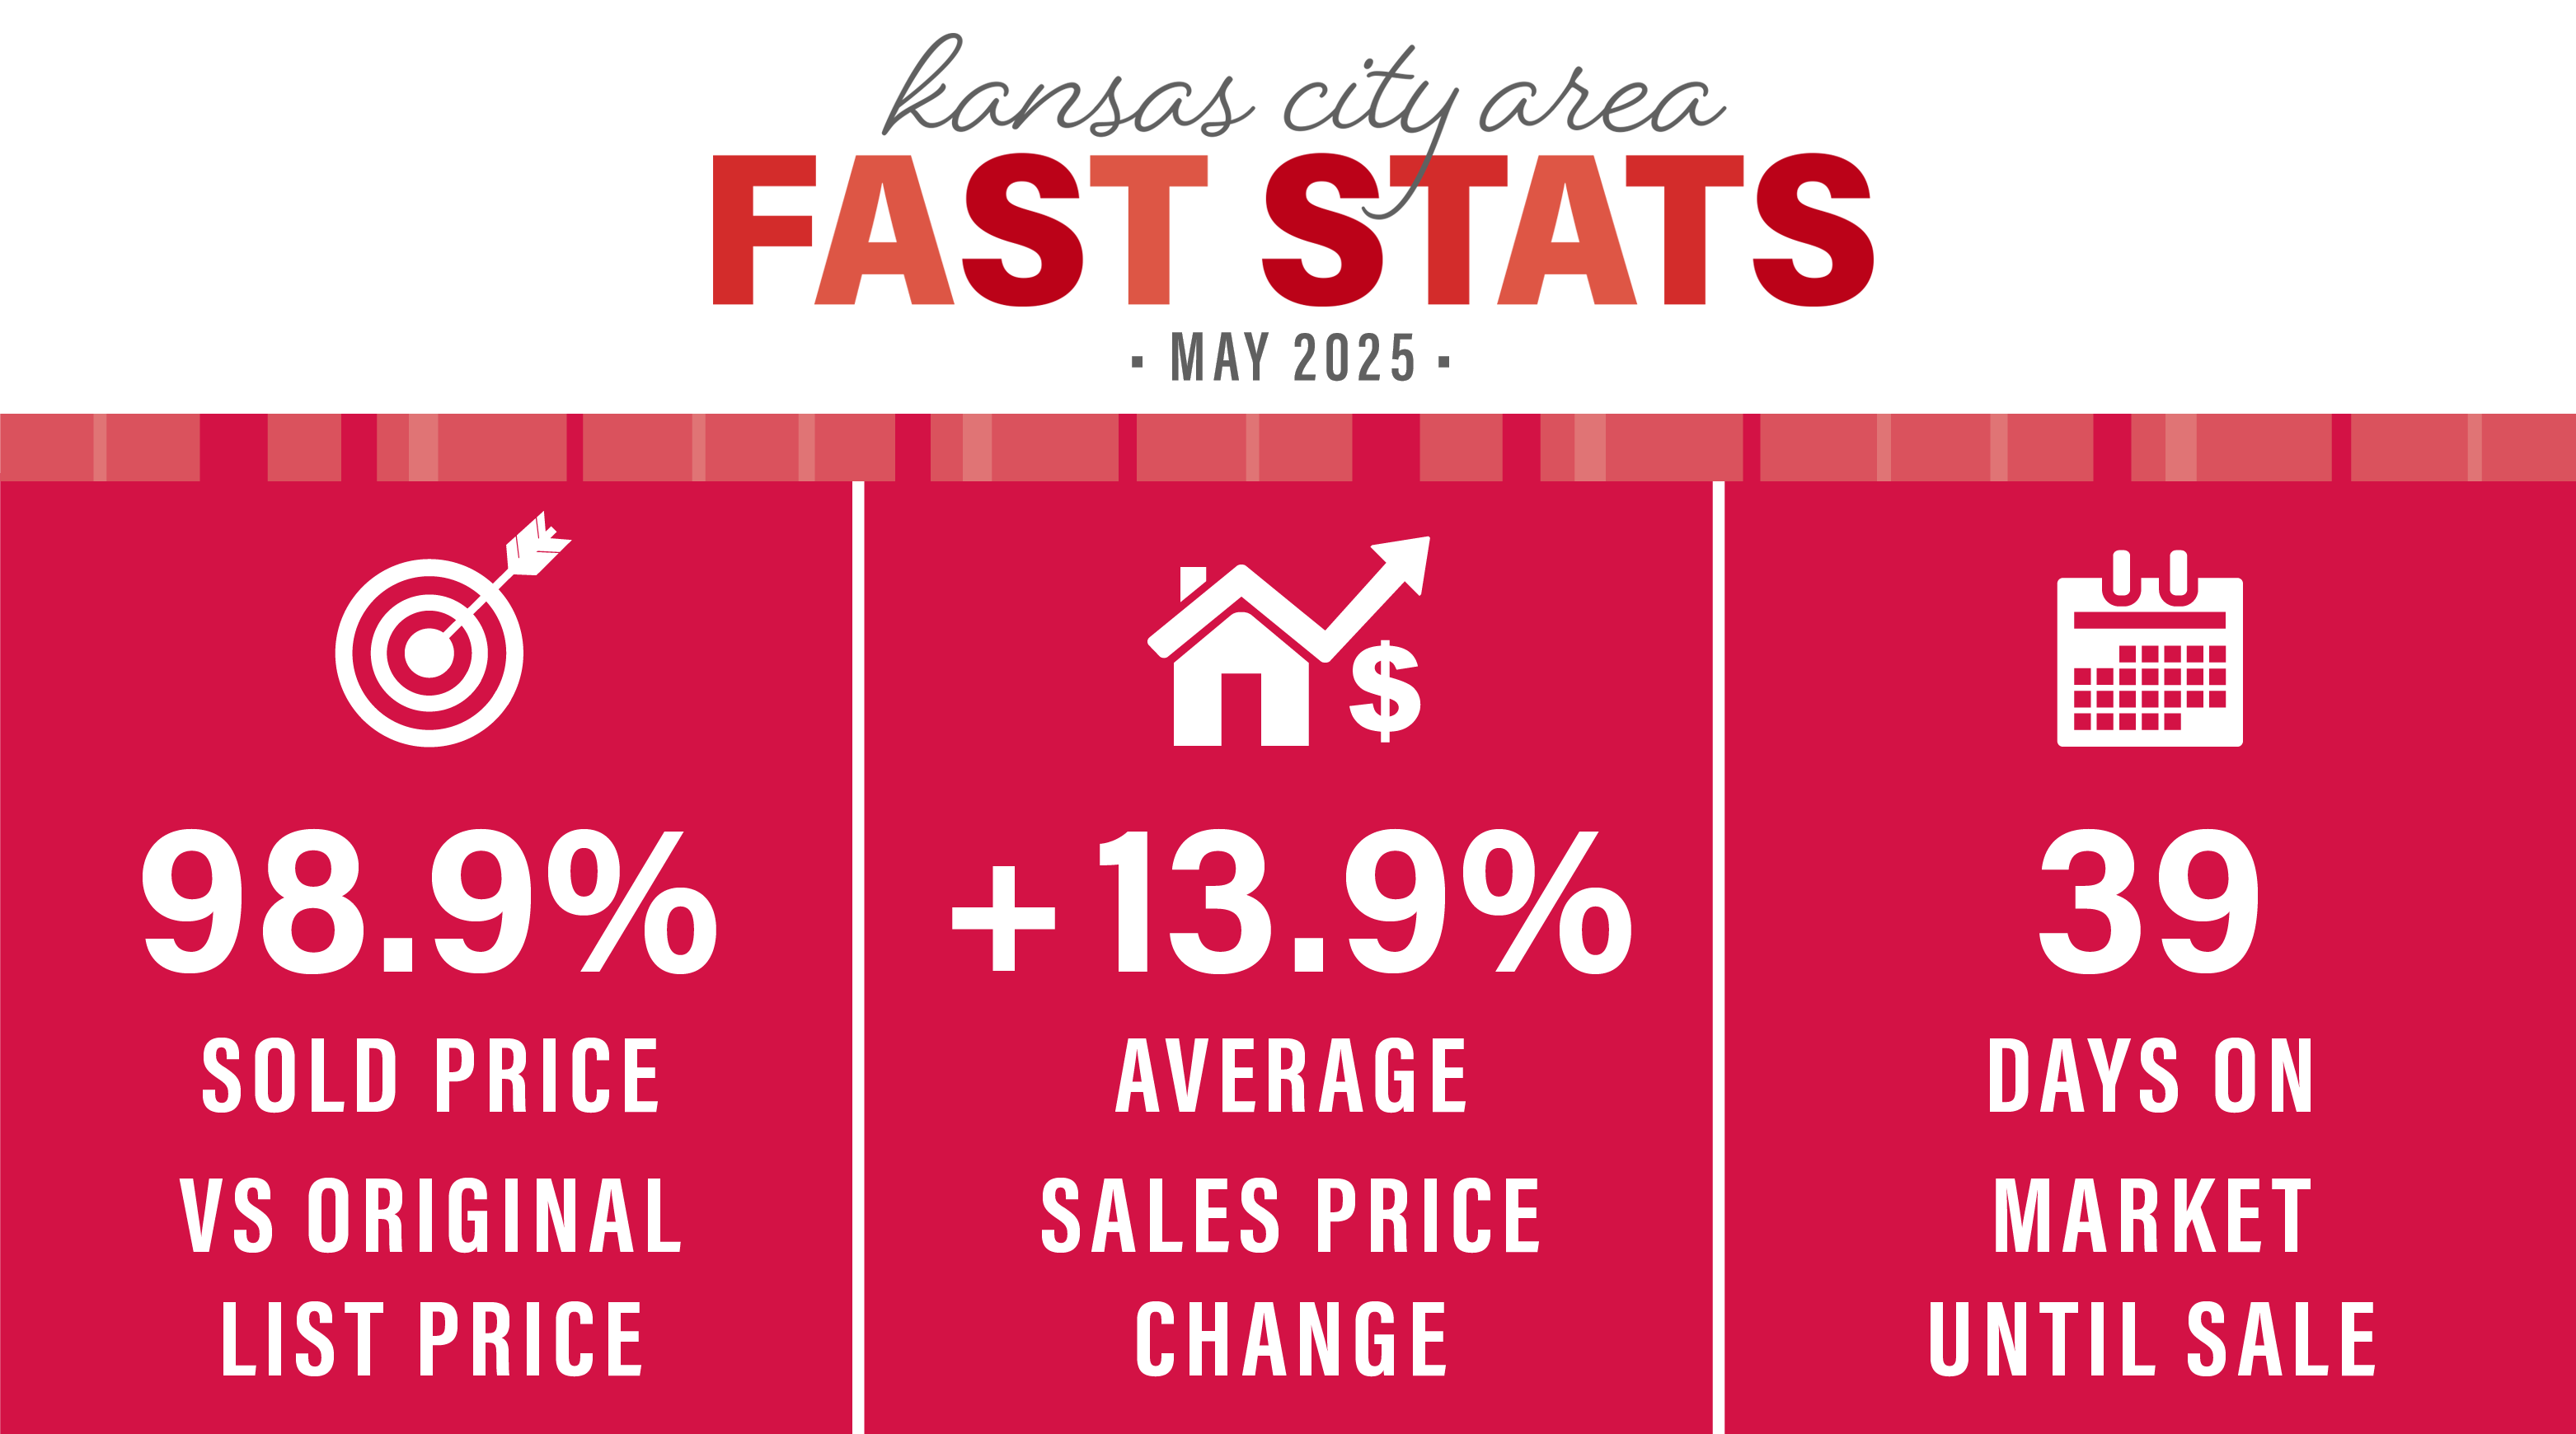
MAY 2025 KANSAS CITY AREA MARKET UPDATE
Homes are selling for an average of 98.9% of the original list price. Days on the market is at 39 days. KC has a 2.5 months supply of homes on the market, which is 7,702 available houses.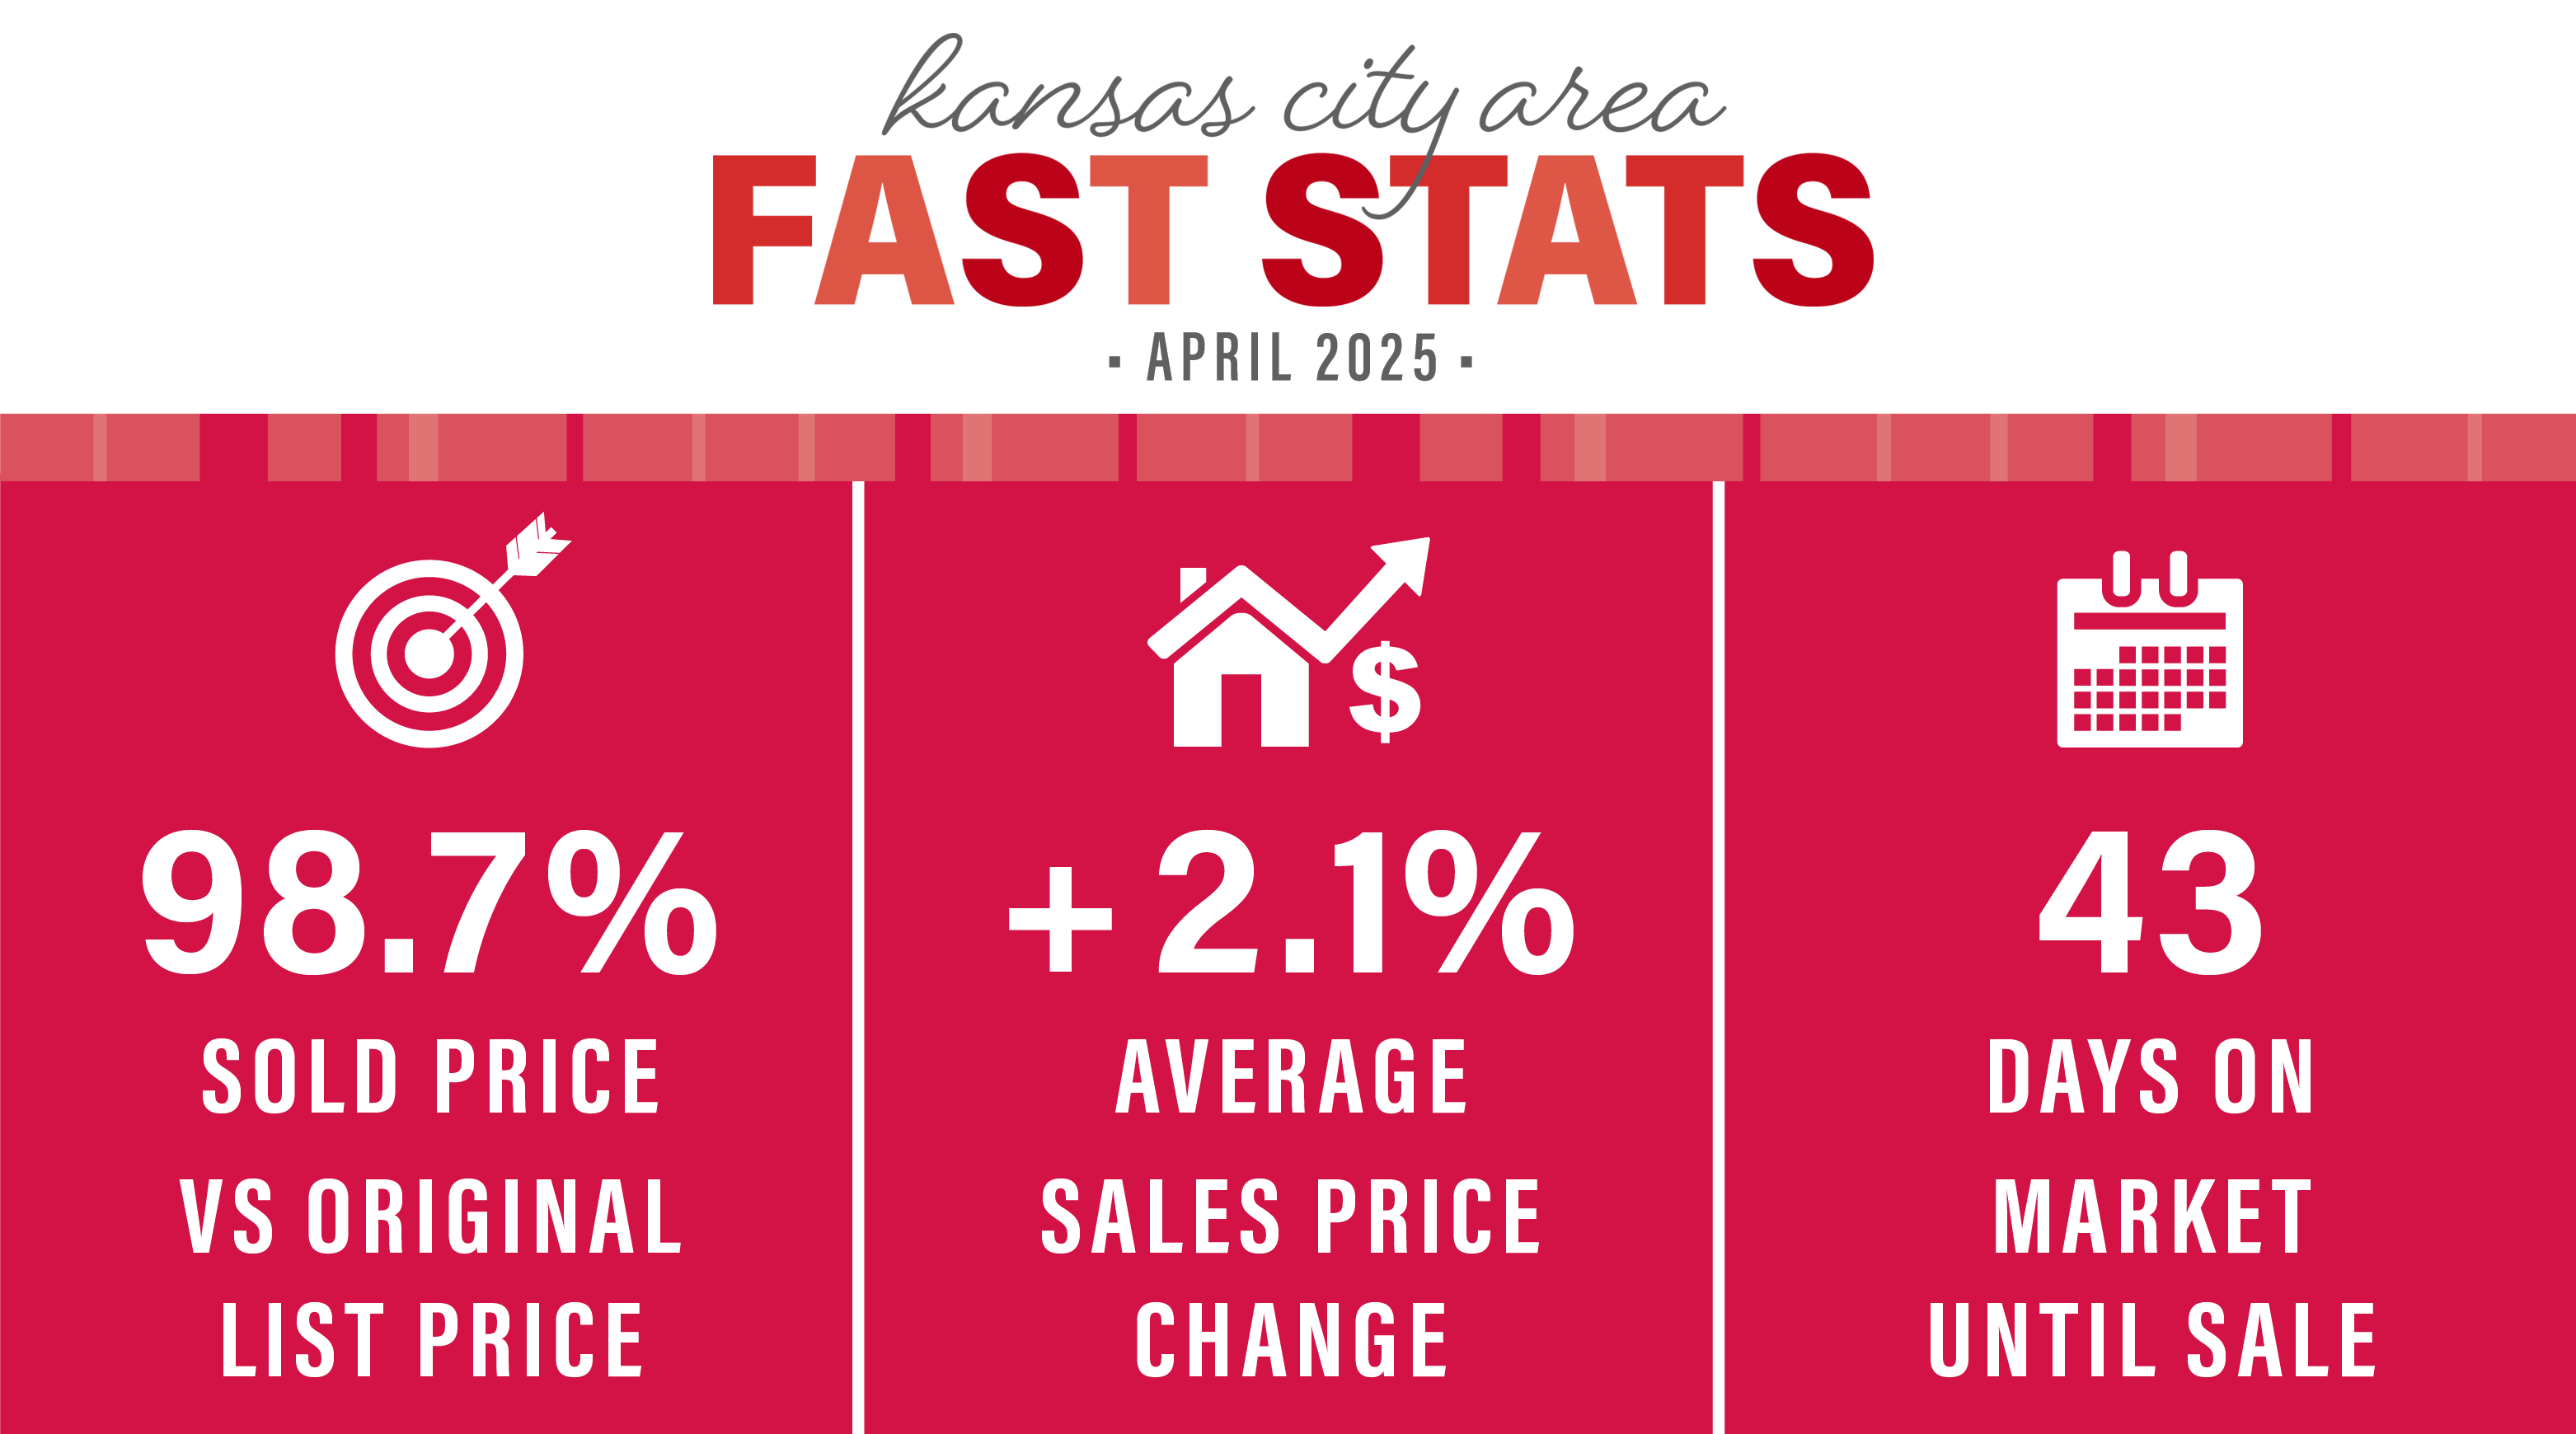
APRIL 2025 KANSAS CITY AREA MARKET UPDATE
Homes are selling for an average of 98.7% of the original list price. Days on the market is at 43 days. KC has a 2.3 months supply of homes on the market, which is 7,070 available houses.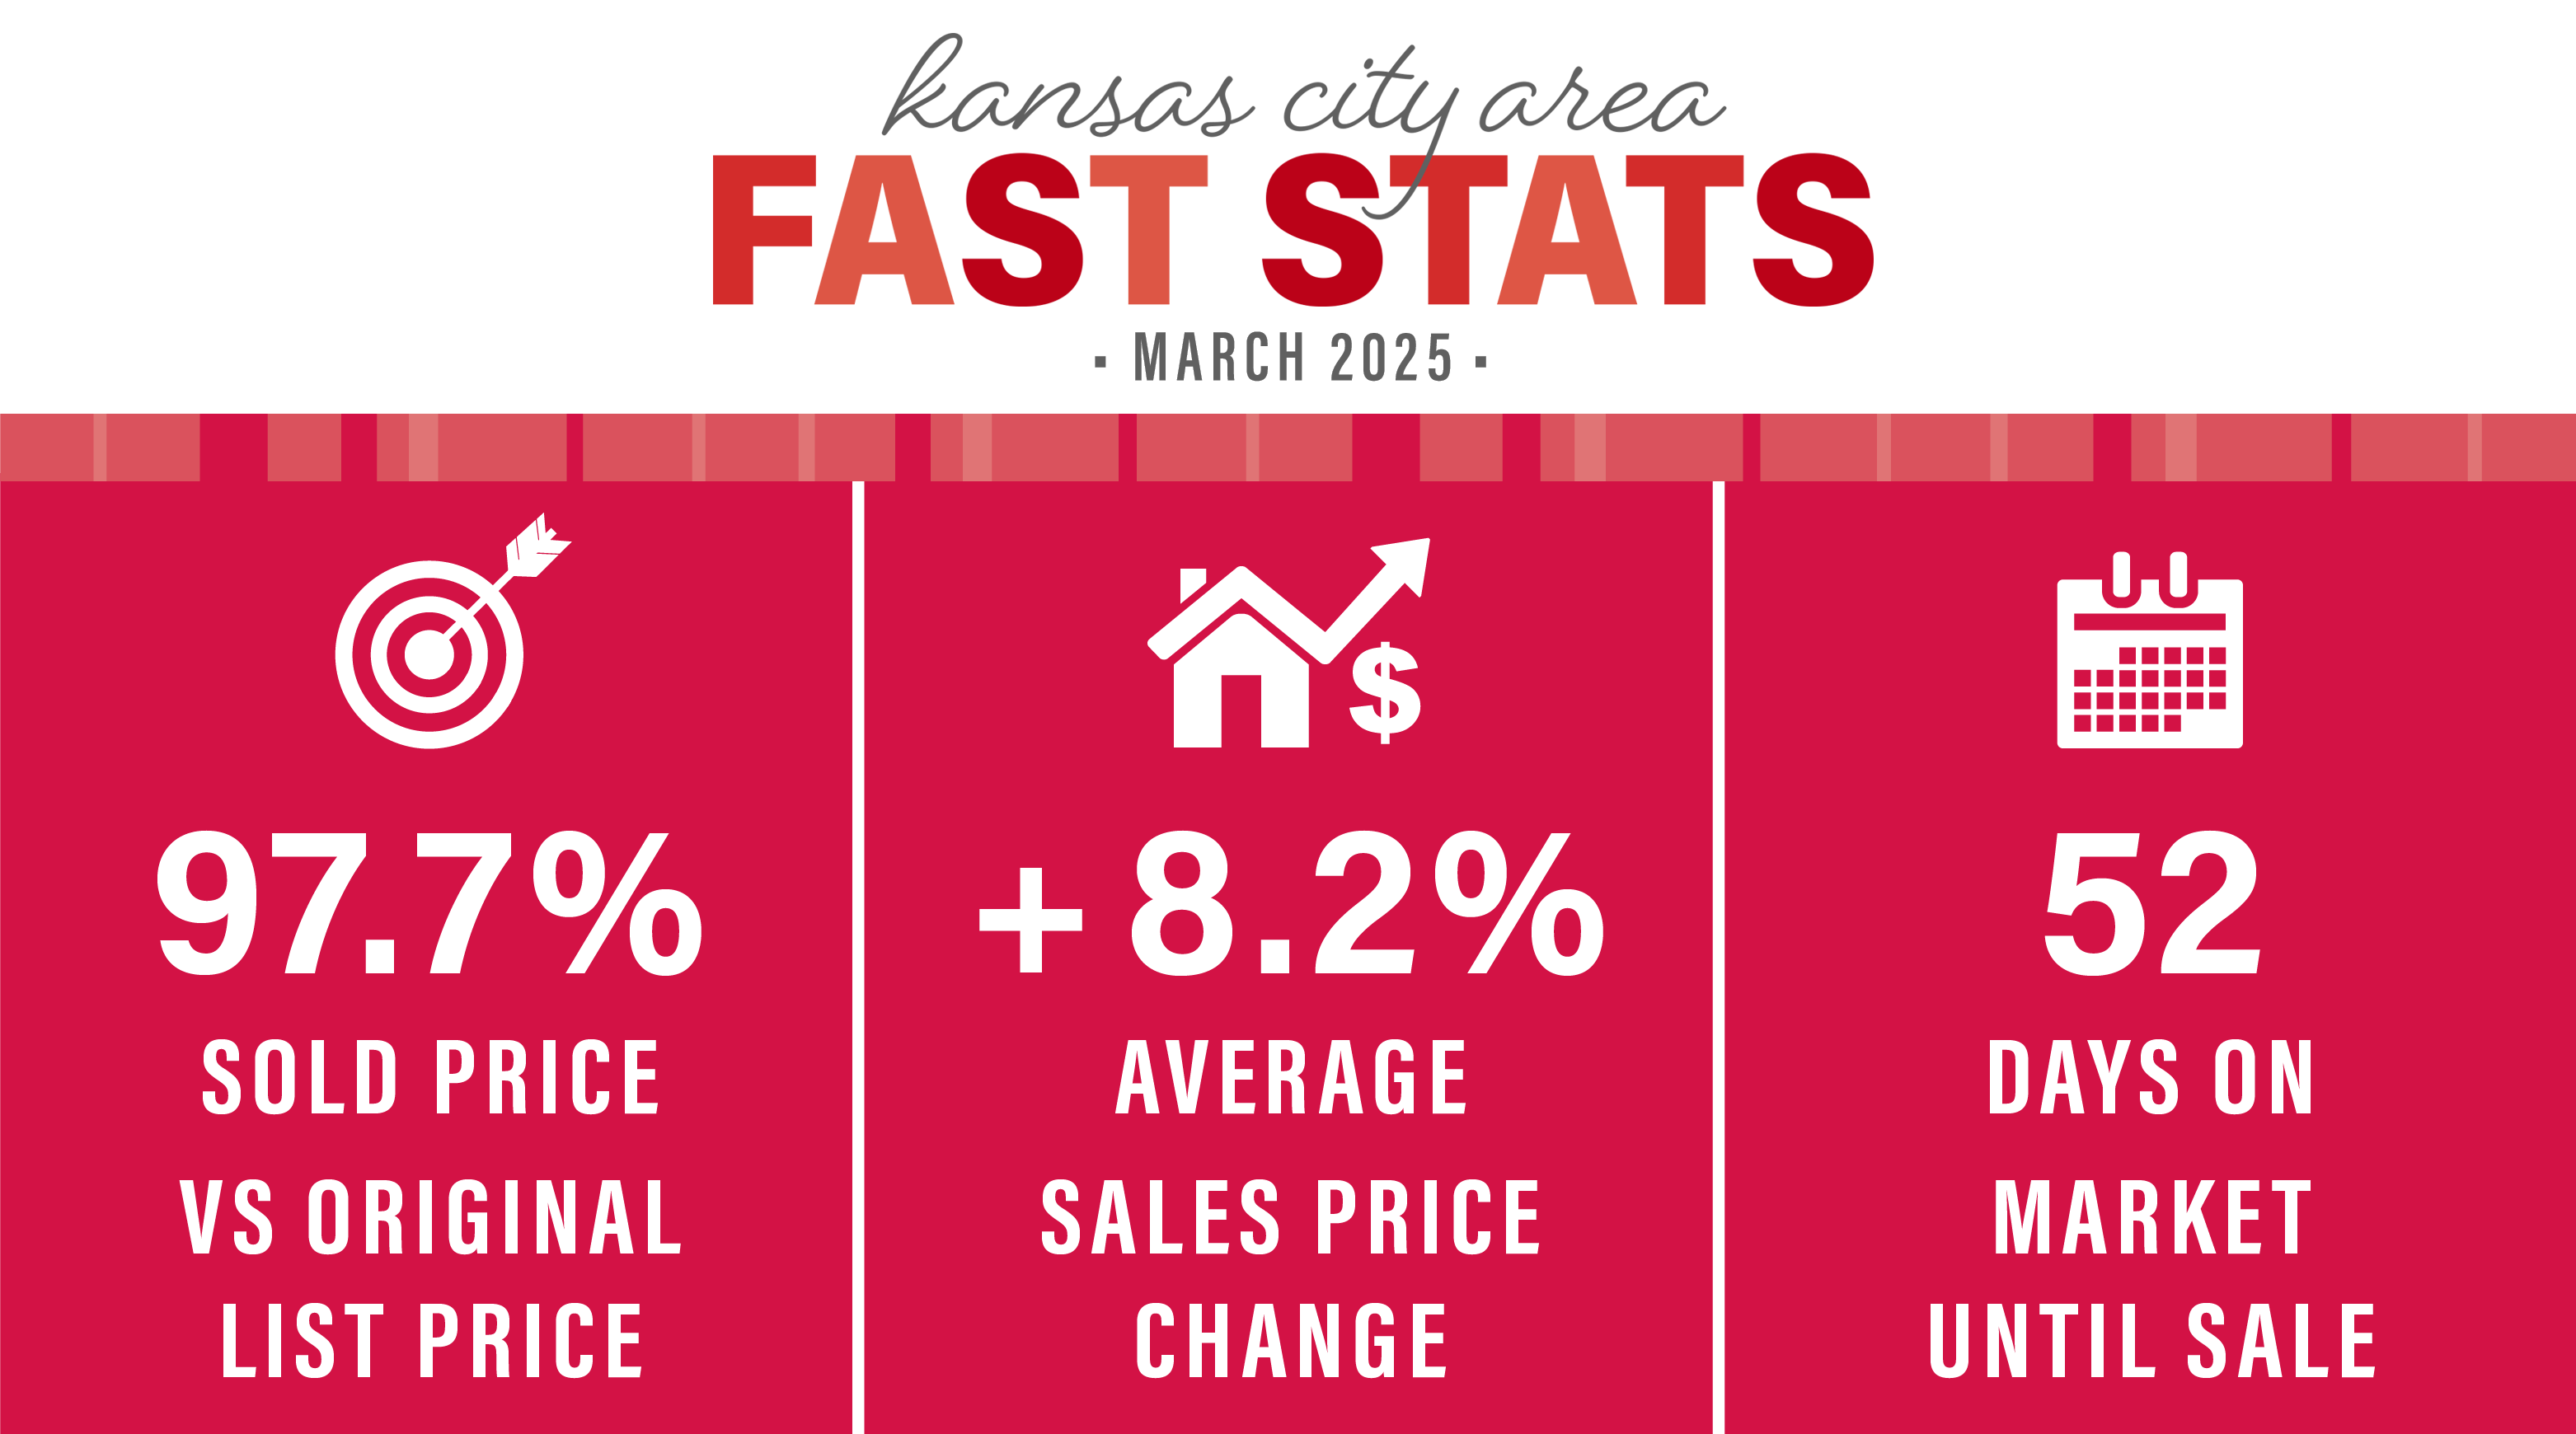
MARCH 2025 KANSAS CITY AREA MARKET UPDATE
Homes are selling for an average of 97.7% of the original list price. Days on the market is at 52 days. KC has a 2.2 months supply of homes on the market, which is 6,560 available houses.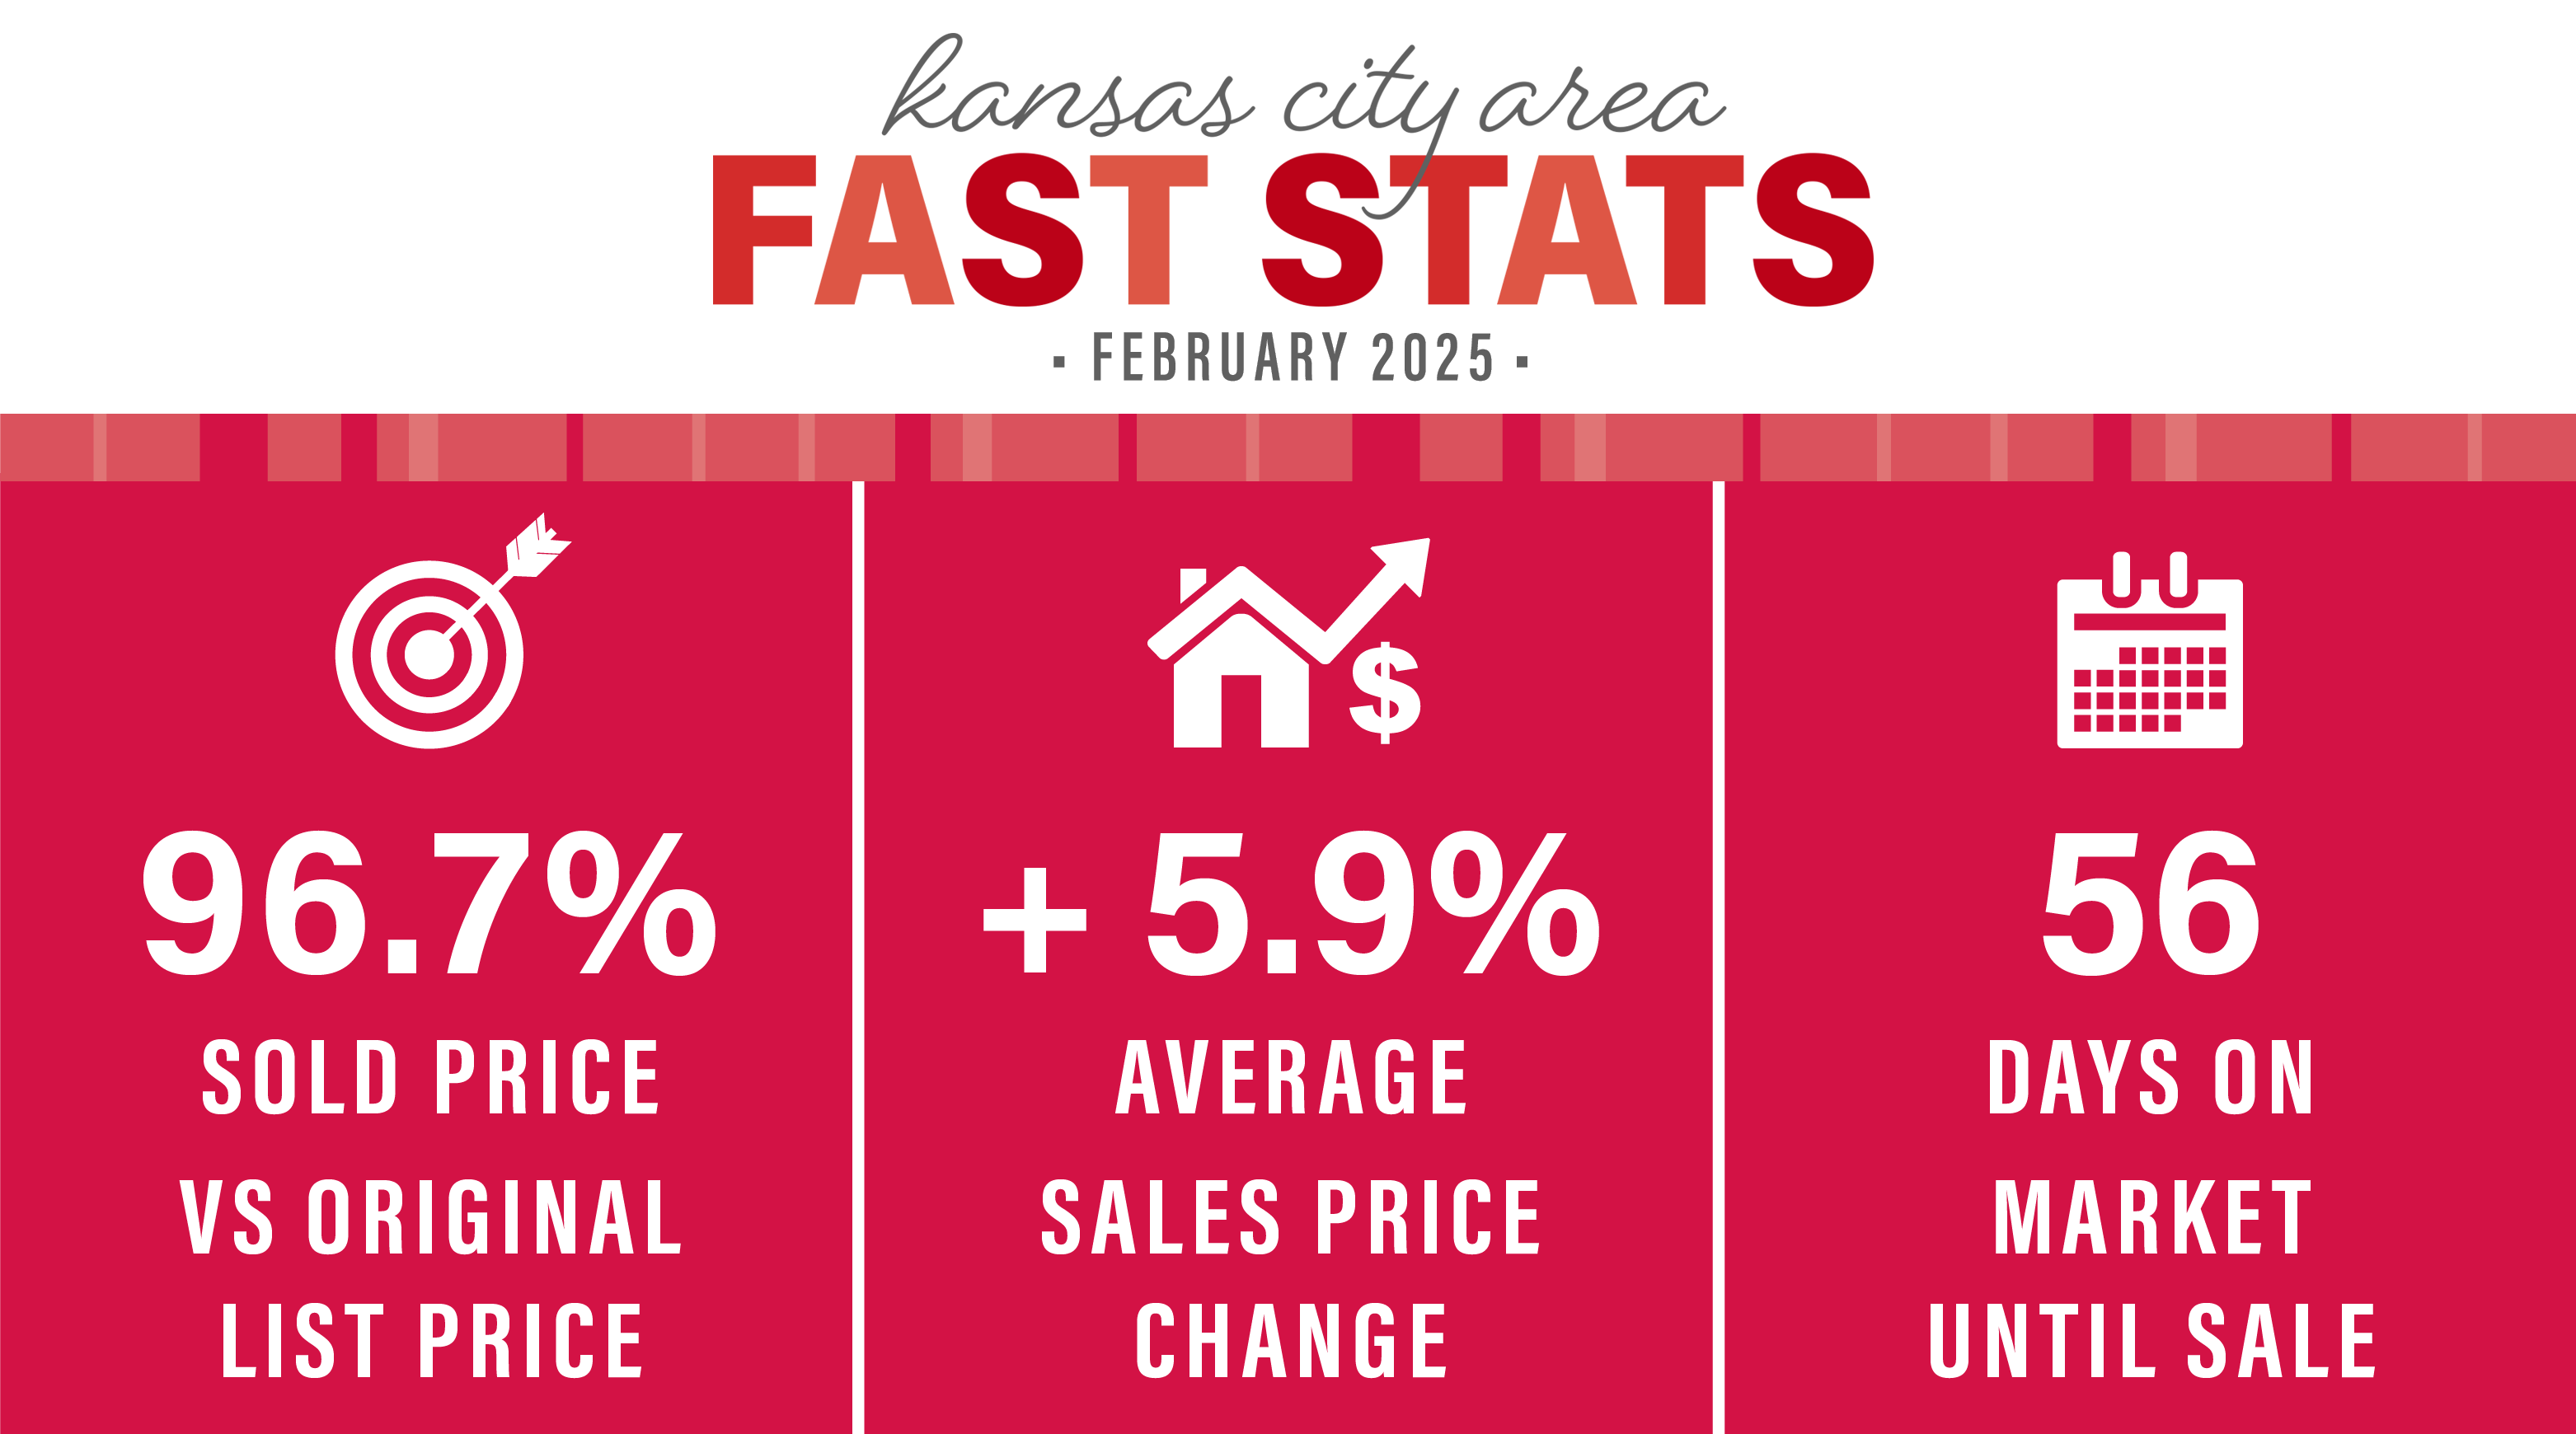
FEBRUARY 2025 KANSAS CITY AREA MARKET UPDATE
Homes are selling for an average of 96.7% of the original list price. Days on the market is at 56 days. KC has a 2.0 months supply of homes on the market, which is 6,185 available houses.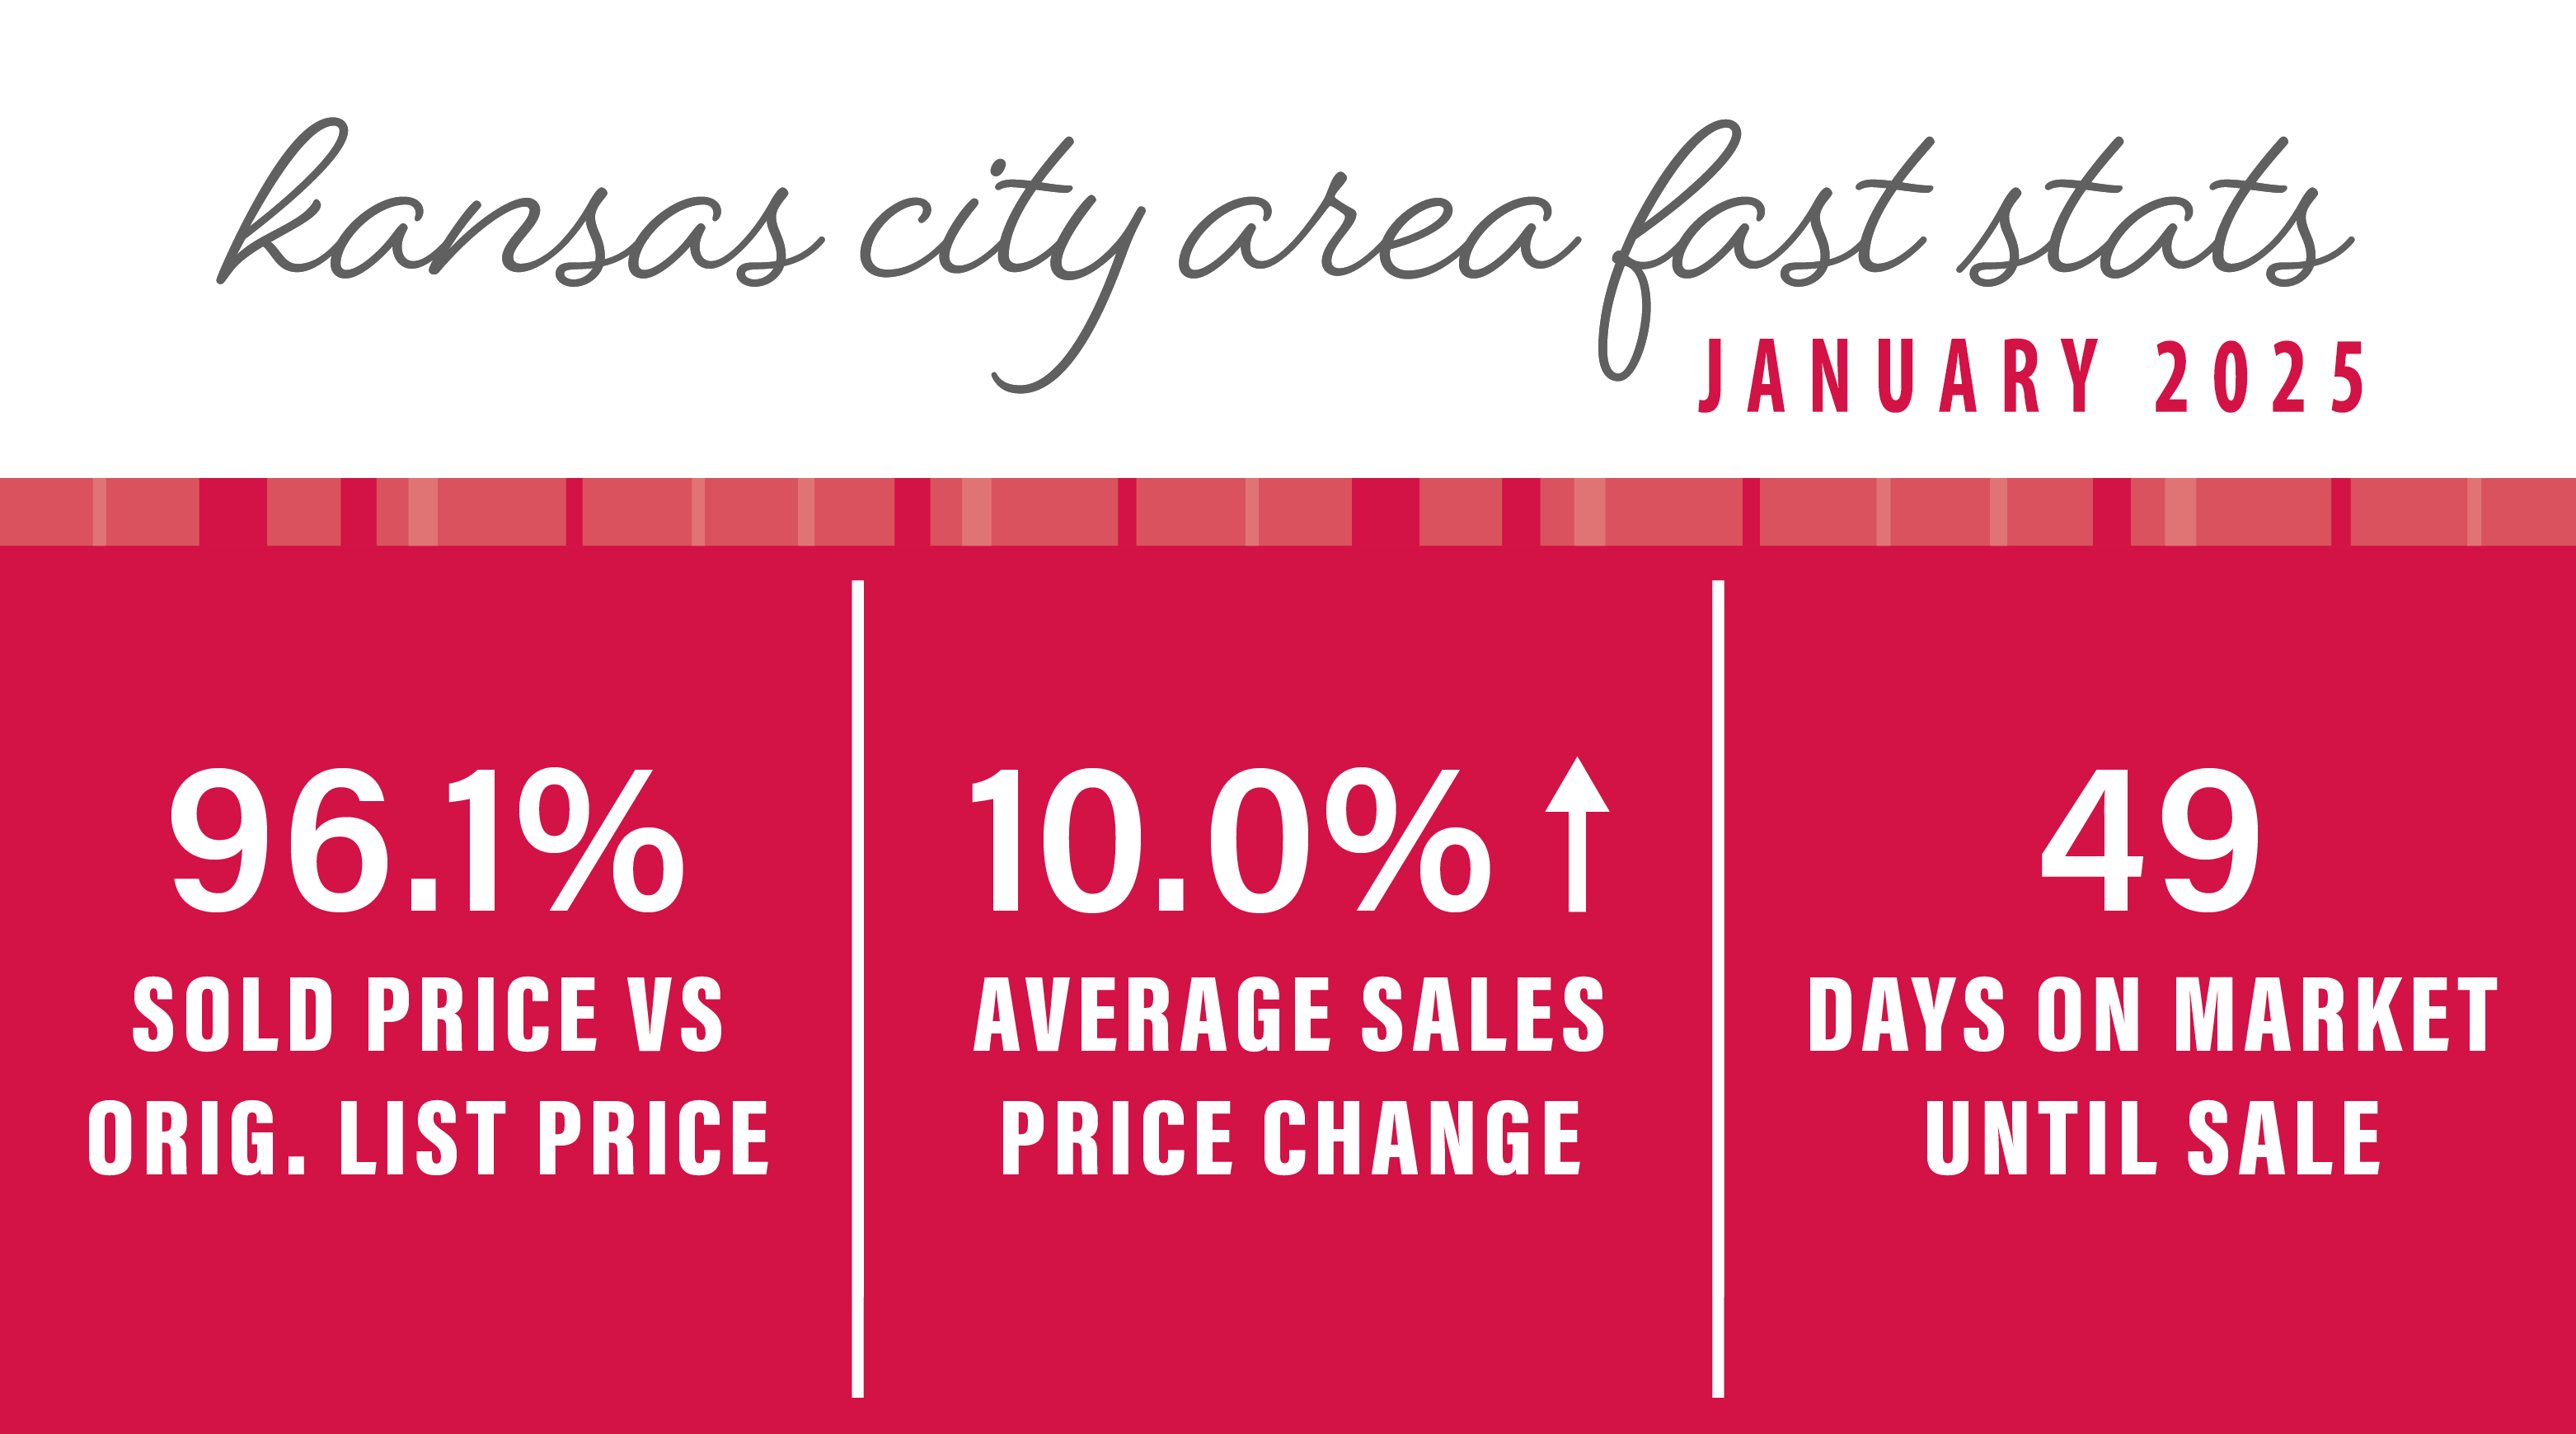
JANUARY 2025 KANSAS CITY AREA MARKET UPDATE
Homes are selling for an average of 96.1% of the original list price. Days on the market is at 49 days. KC has a 2.0 months supply of homes on the market, which is 6,225 available houses.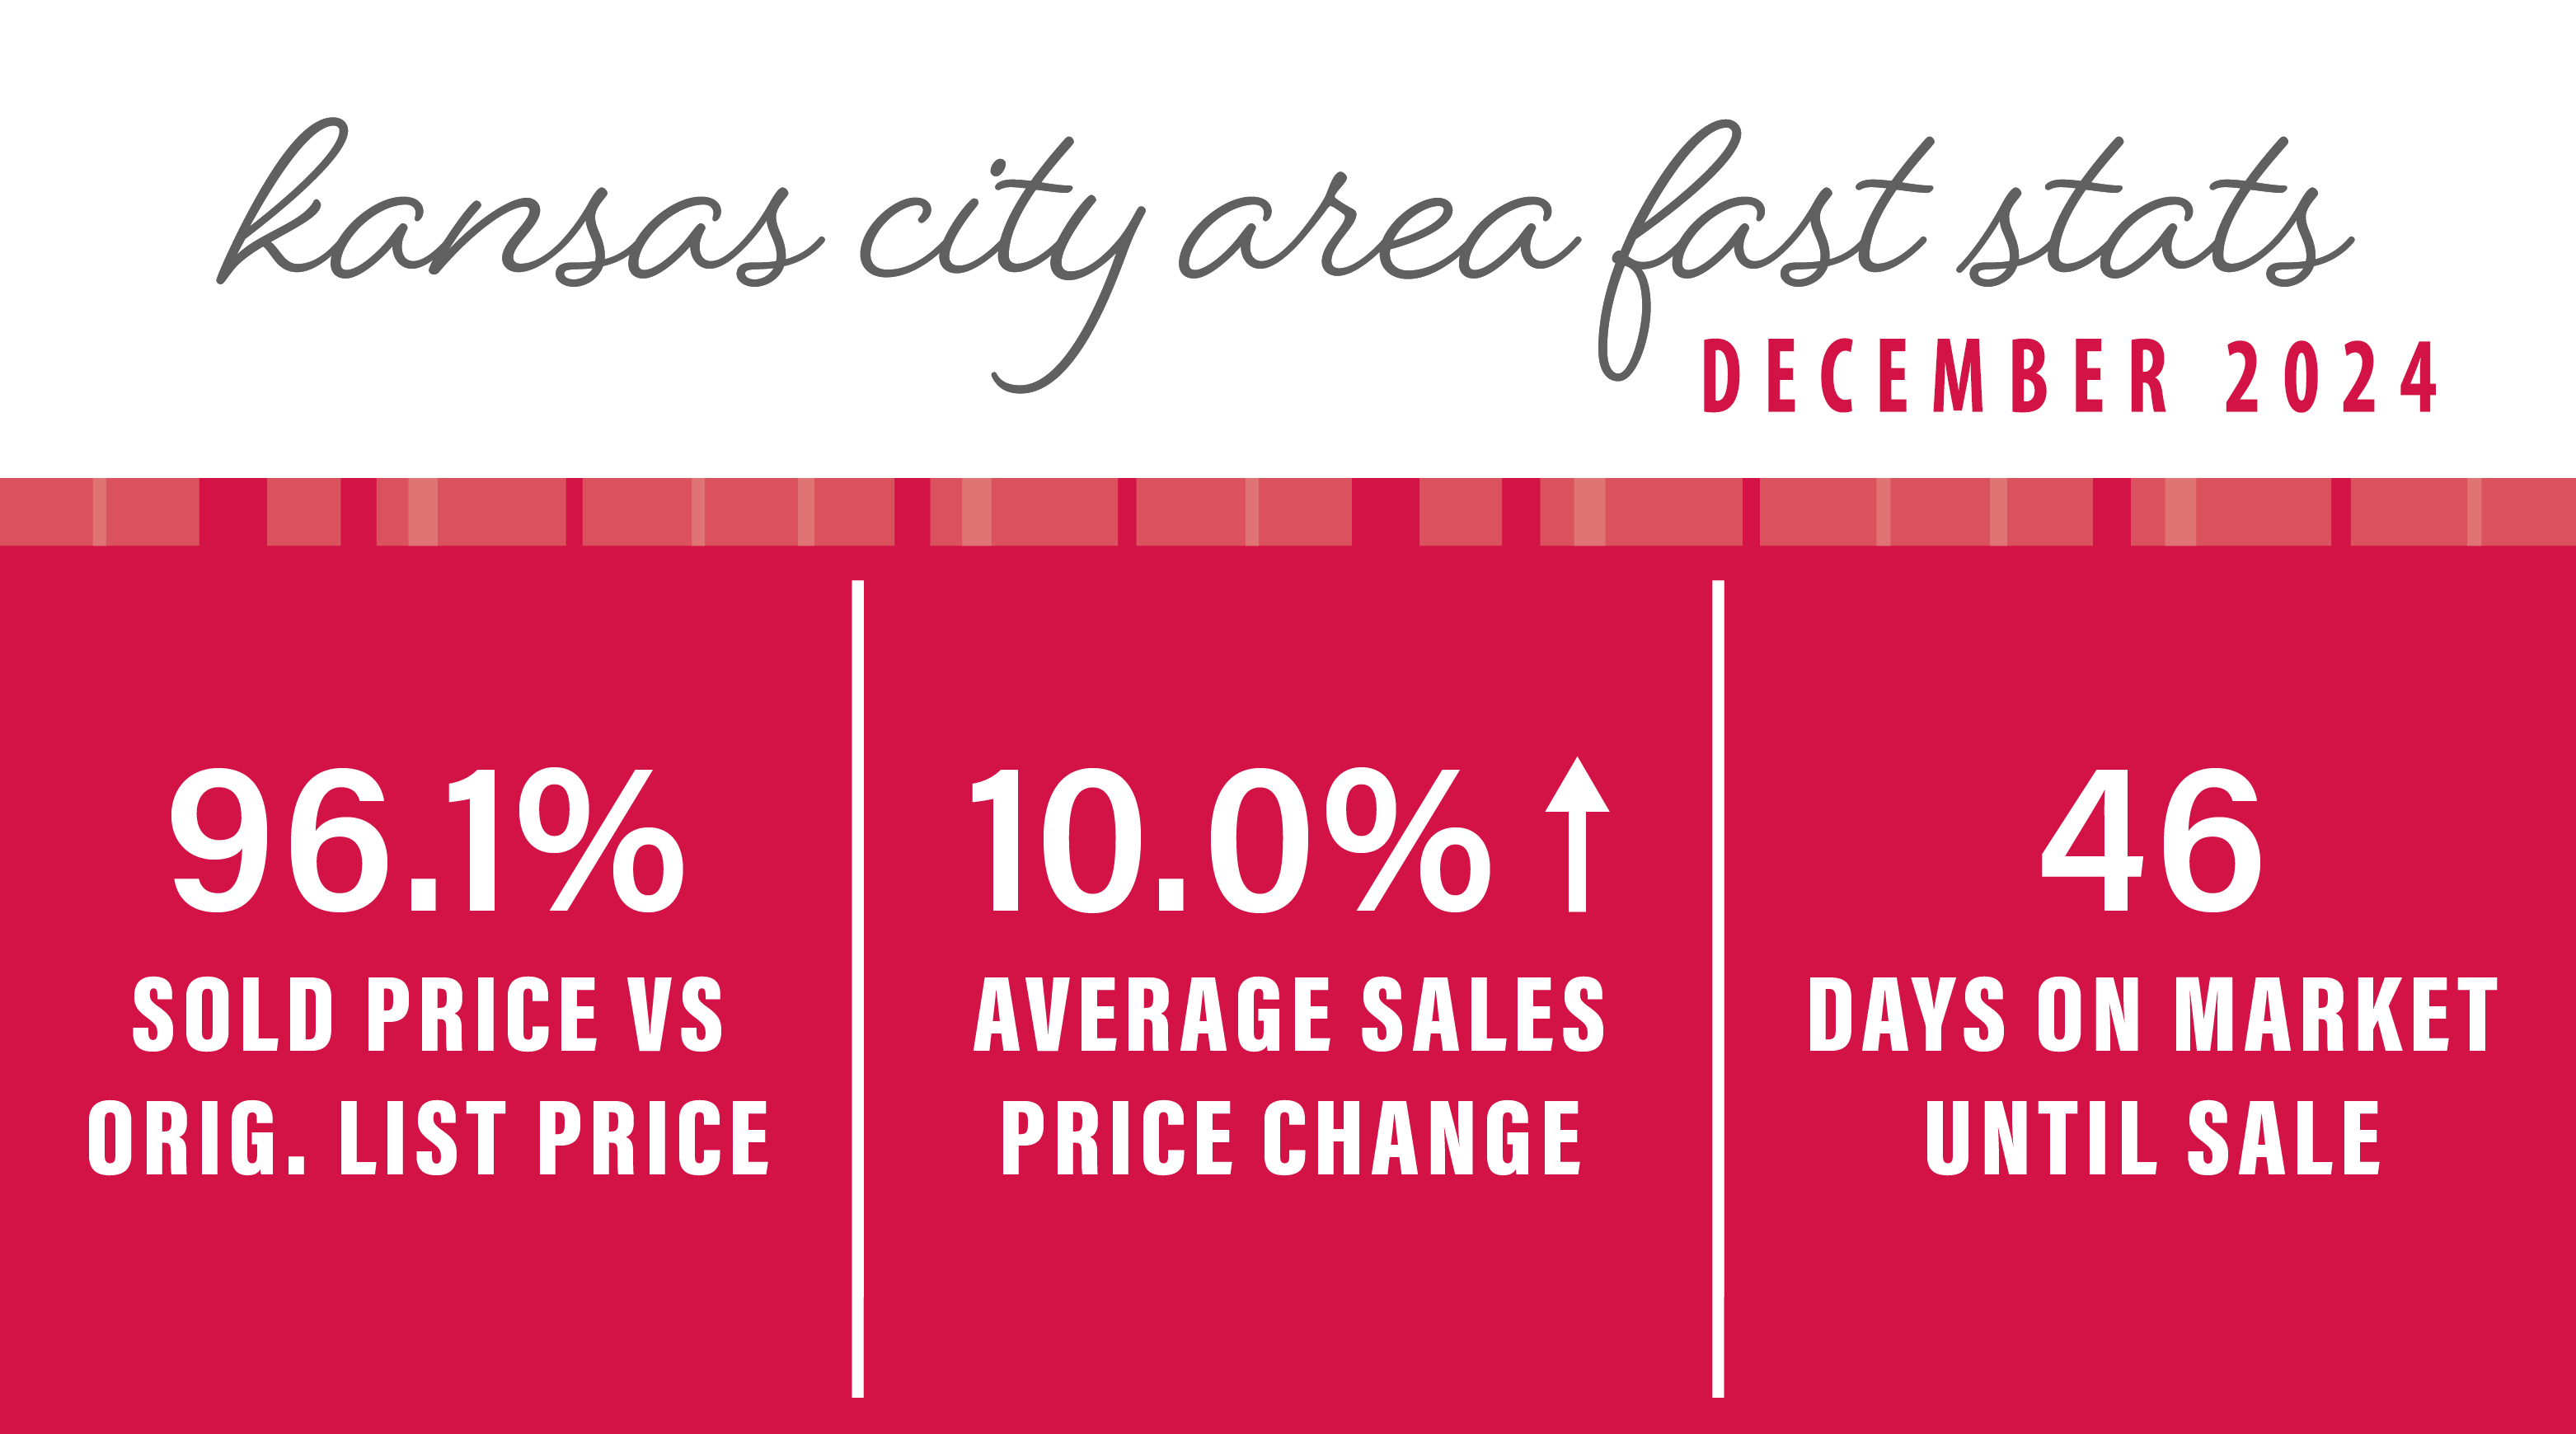
DECEMBER 2024 KANSAS CITY AREA MARKET UPDATE
Homes are selling for an average of 96.1% of the original list price. Days on the market is at 46 days. KC has a 2.1 months supply of homes on the market, which is 6,306 available houses.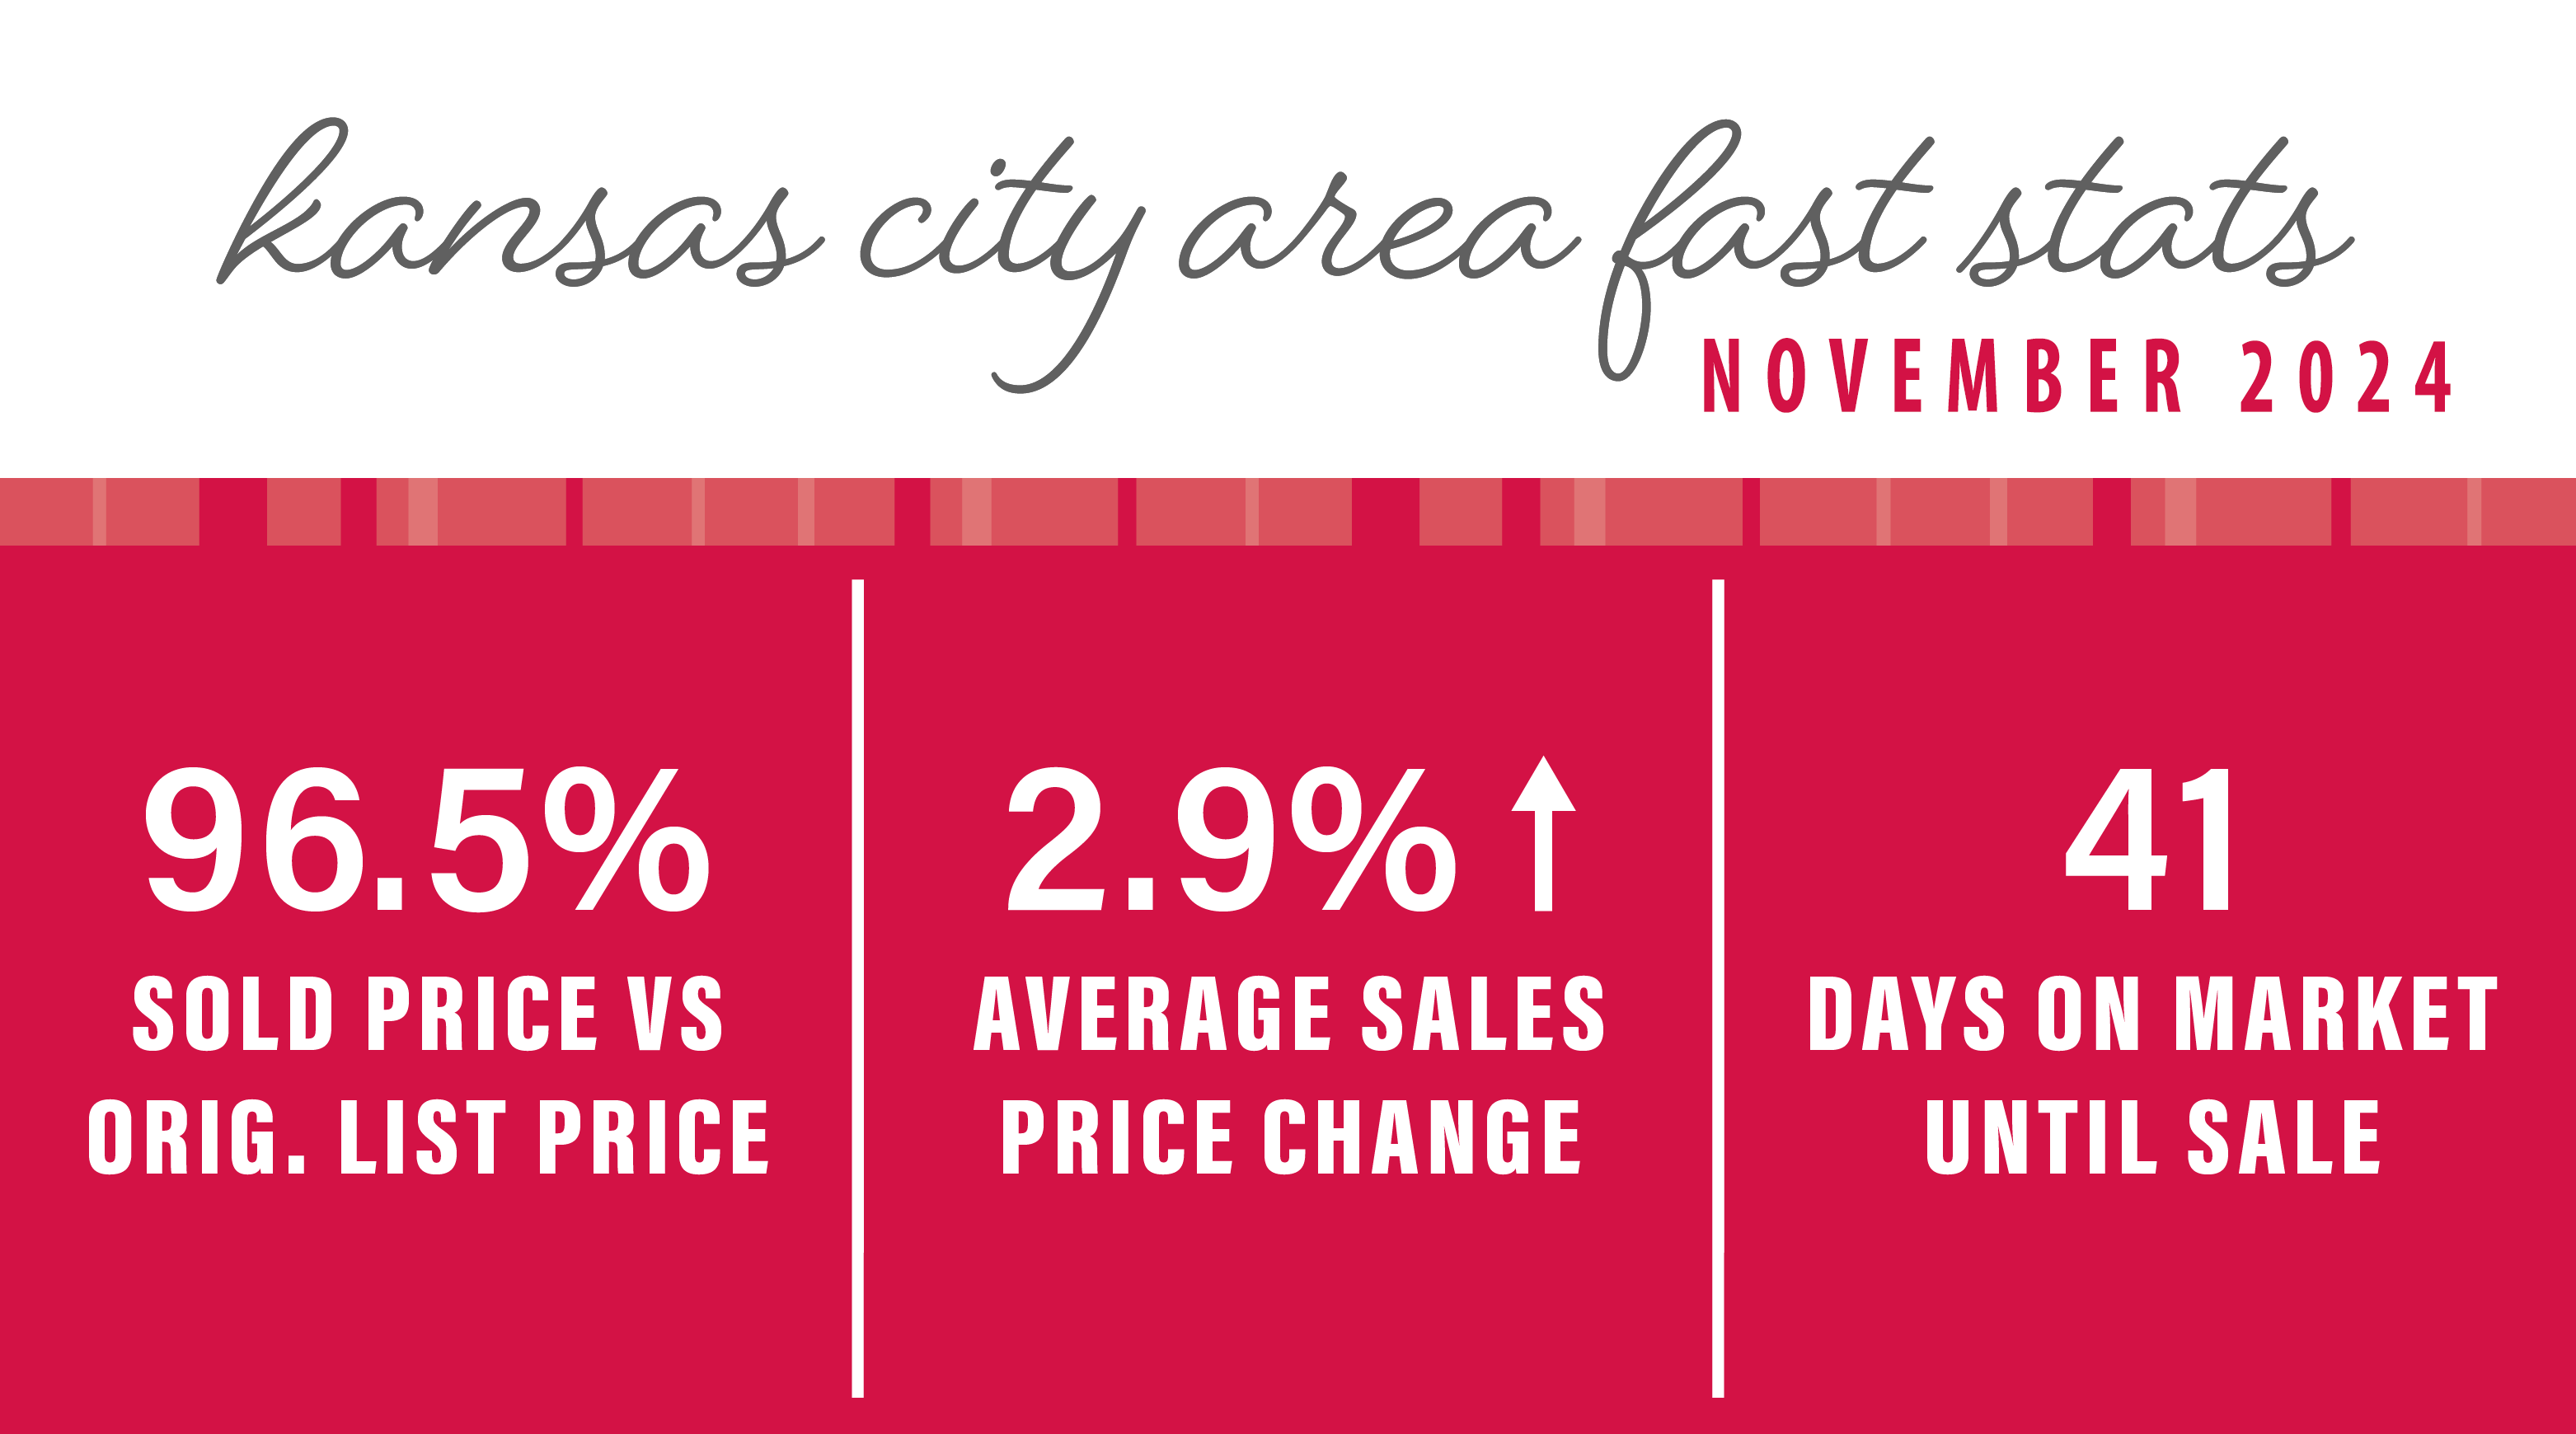
NOVEMBER 2024 KANSAS CITY AREA MARKET UPDATE
Homes are selling for an average of 96.5% of the original list price. Days on the market is at 41 days. KC has a 2.4 months supply of homes on the market, which is 7,191 available houses.