
DECEMBER 2025 KANSAS CITY AREA MARKET UPDATE
Homes in the Kansas City metro sold for an average of 95.7% of list price in December 2025, with 49 days on market and 2.2 months of inventory. While many areas remain in a seller’s market, select price...
How to Choose the Top Real Estate Agents in Kansas City
What really defines a top real estate agent in Kansas City? This guide explains what to look for—and why experience, local knowledge, and consistency matter when choosing an agent in the KC market.
New Year, New Home Goals
The perfect time to make a move, is when it's right for you. As rates start to shift, more buyers and sellers will enter the market. If you're thinking about making a move in 2026, it's worth it to start the...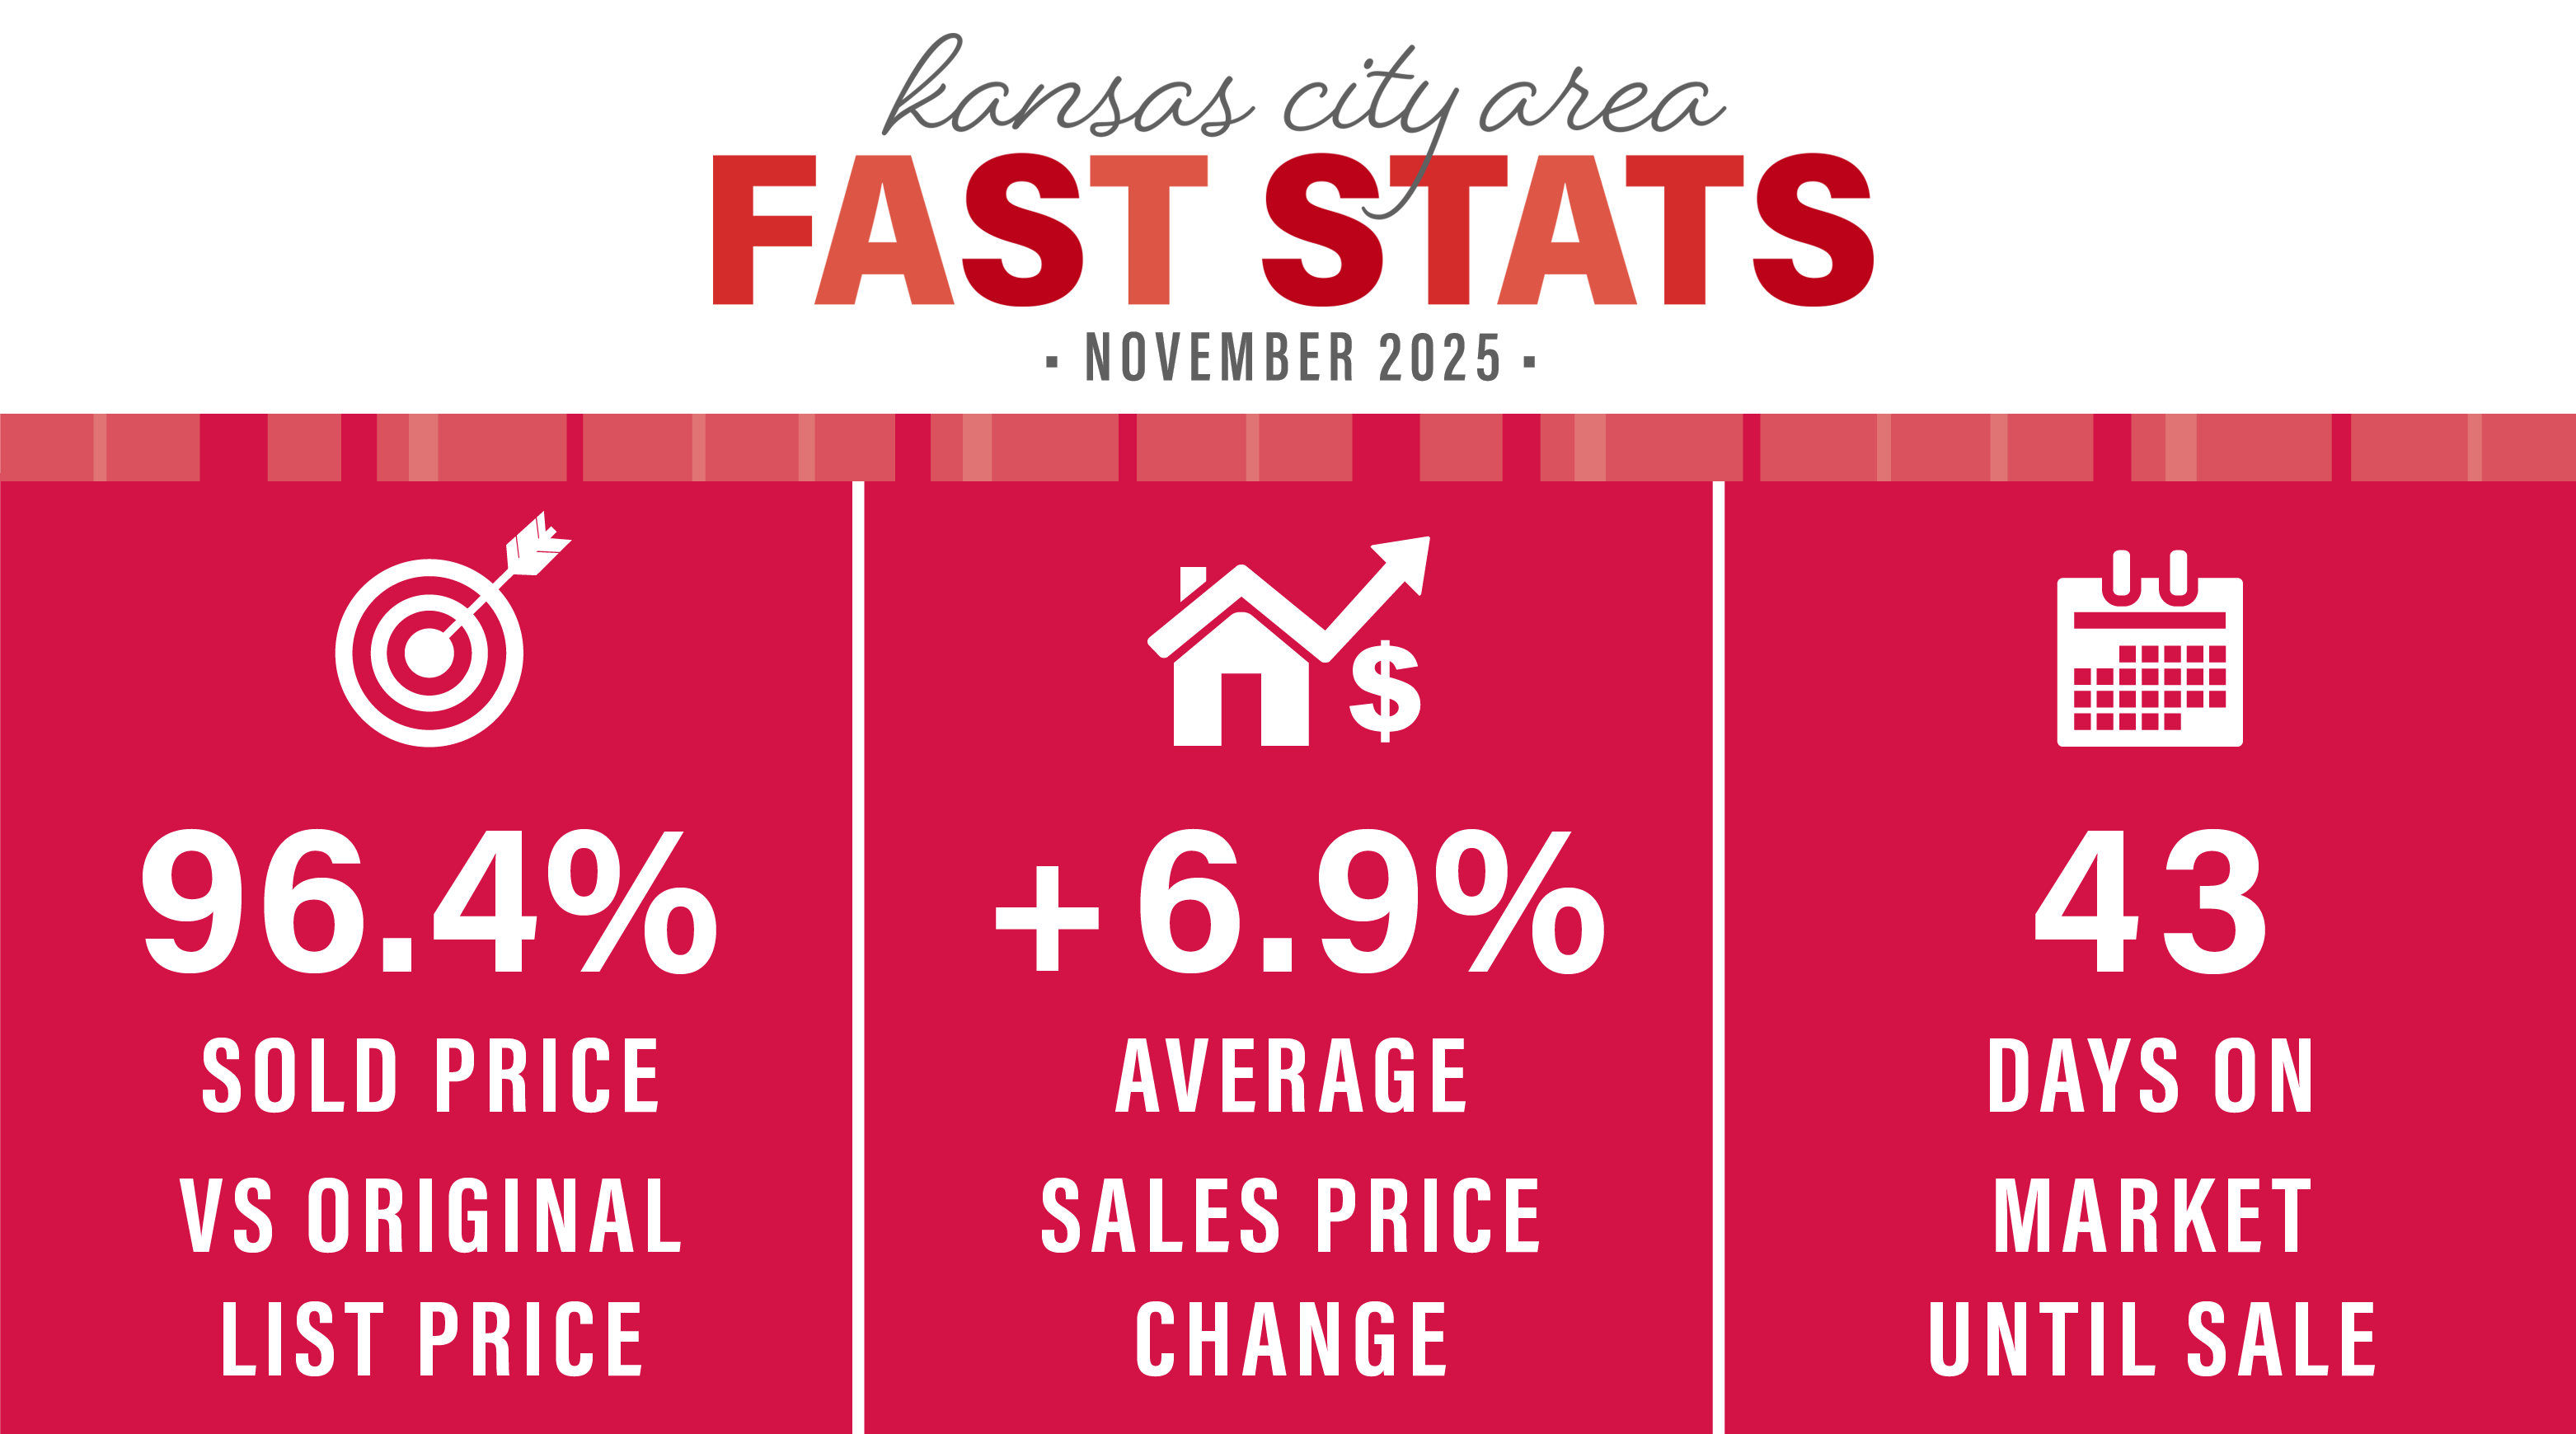
NOVEMBER 2025 KANSAS CITY AREA MARKET UPDATE
Homes are selling for an average of 96.4% of the original list price. Days on the market is at 43 days. KC has a 2.6 months supply of homes on the market, which is 8,066 available houses.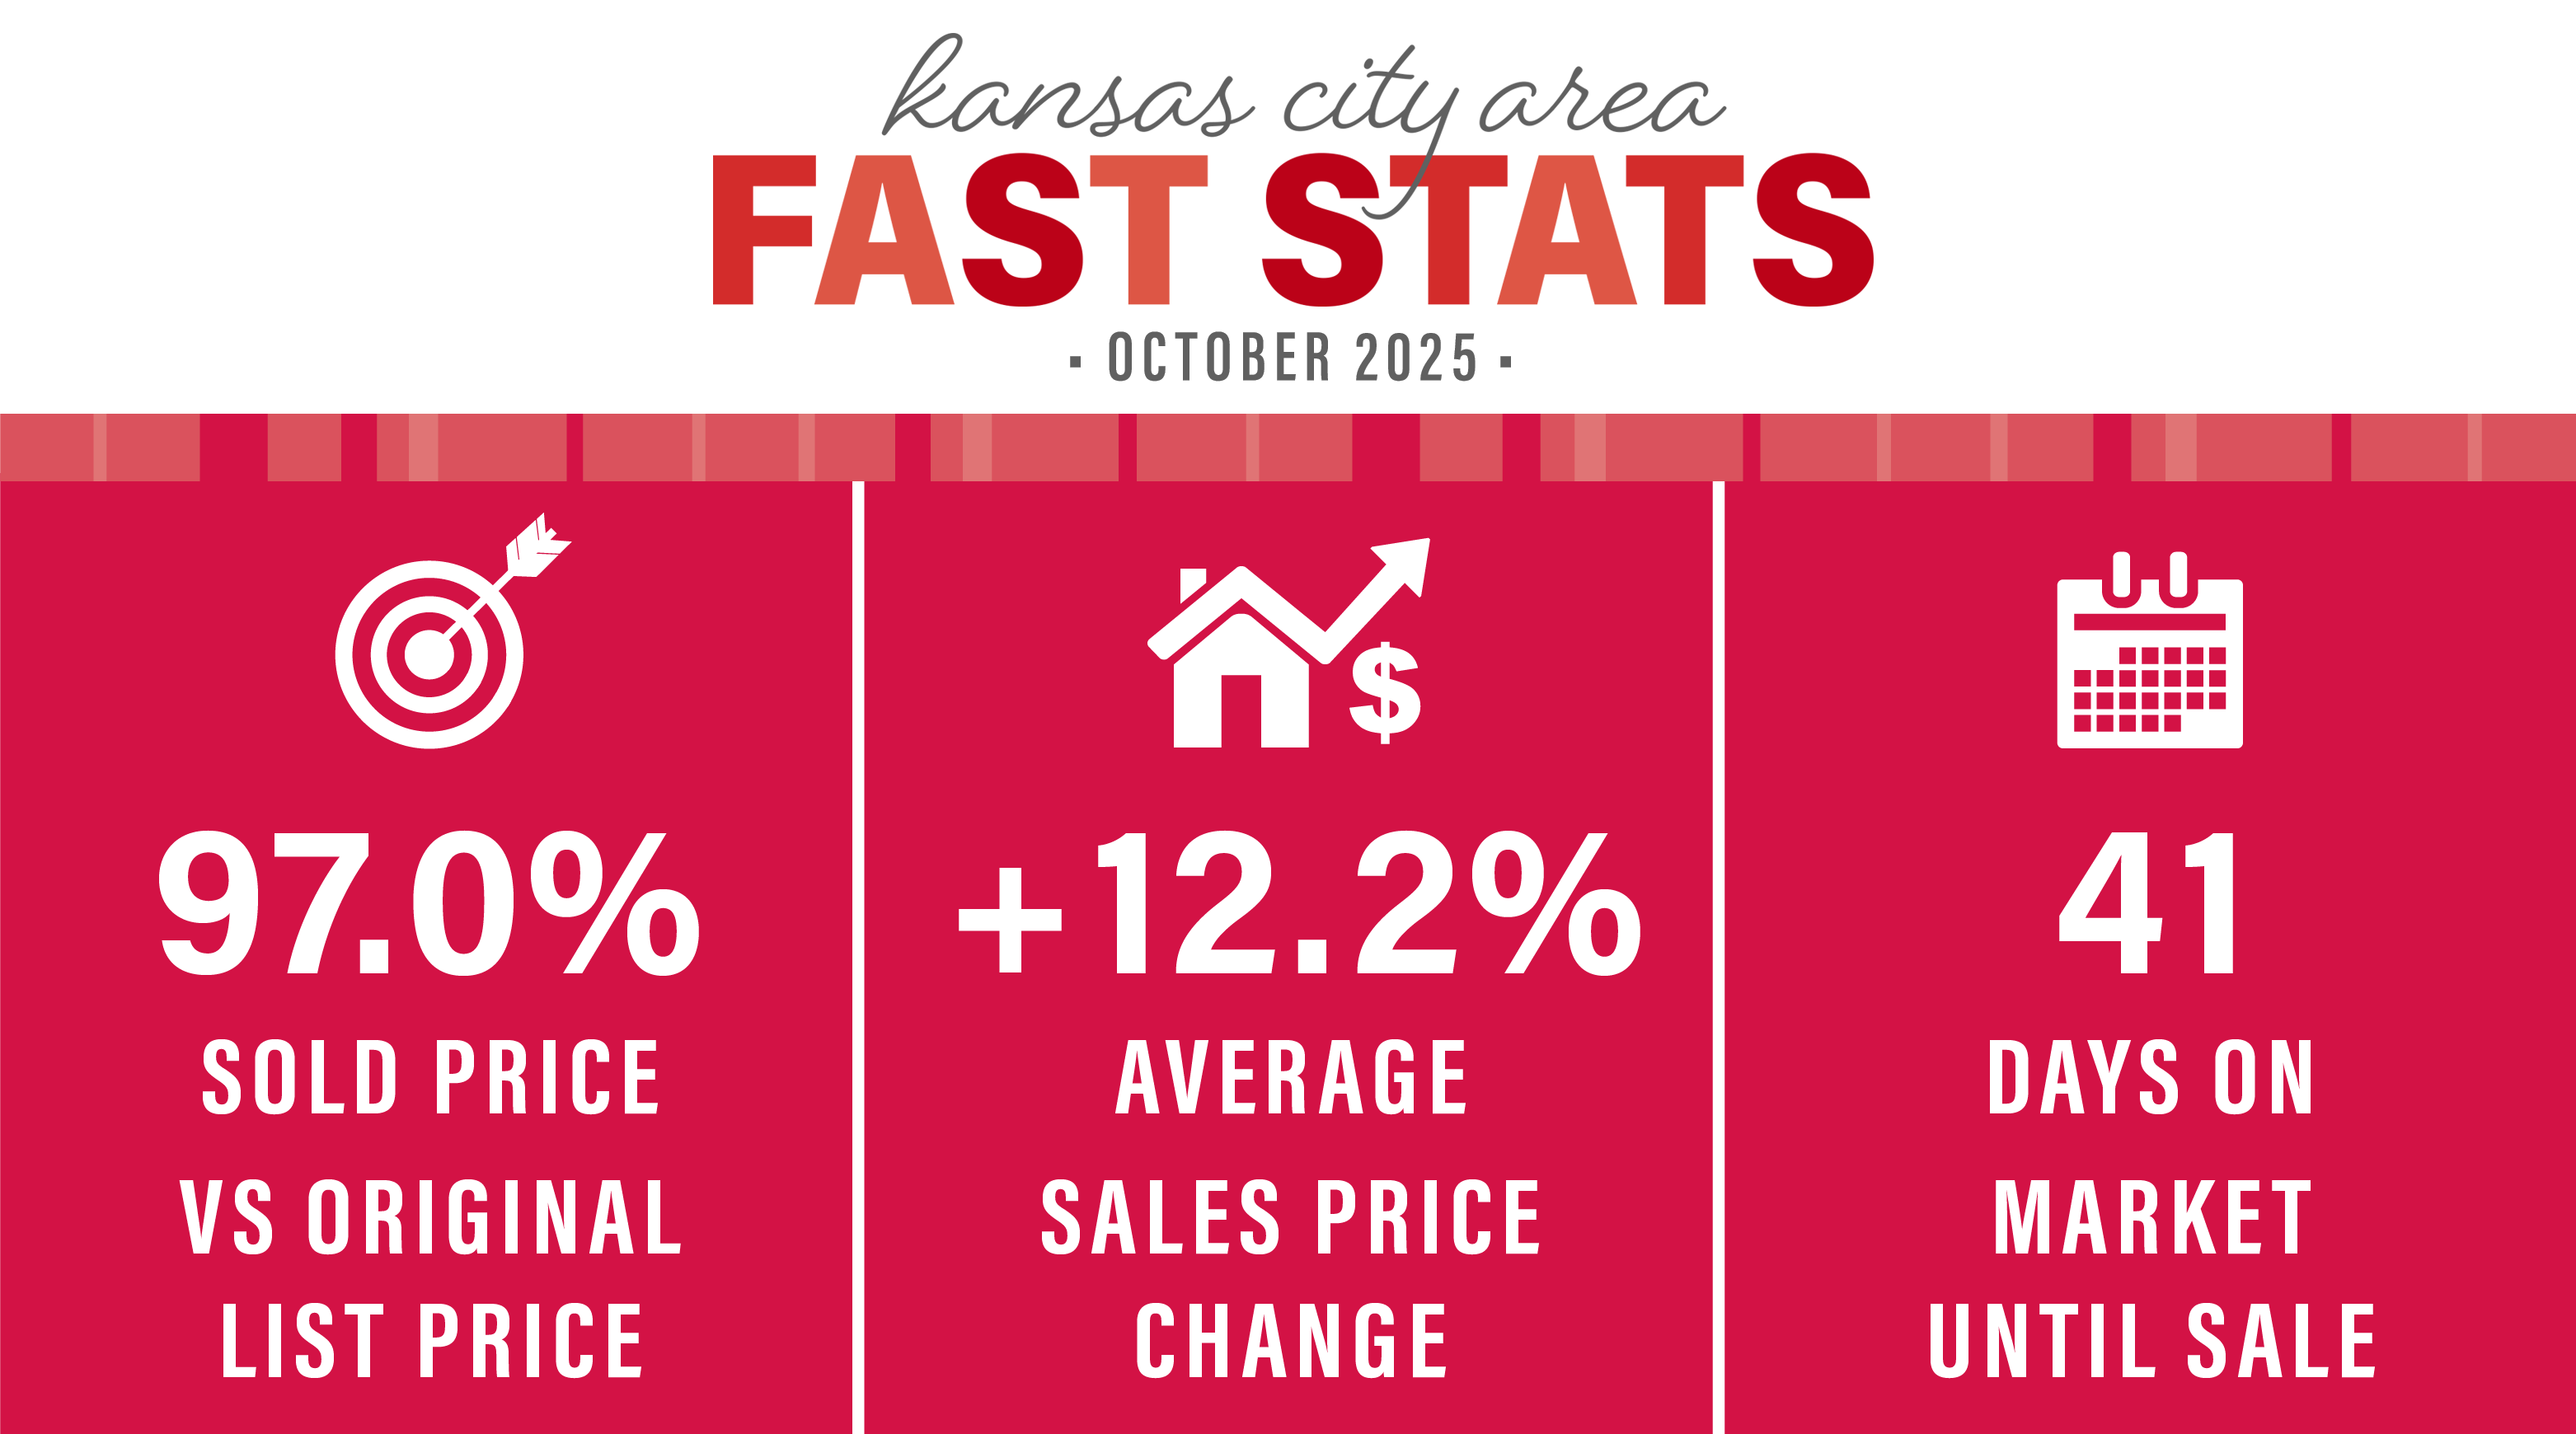
OCTOBER 2025 KANSAS CITY AREA MARKET UPDATE
Homes are selling for an average of 97.0% of the original list price. Days on the market is at 41 days. KC has a 2.8 months supply of homes on the market, which is 8,714 available houses.
The Power of Gratitude
It’s often said that gratitude benefits the person offering it as much as the person receiving it. Improved sleep, reduced stress, and a stronger sense of well-being are just a few of the ways gratitude can...
SEPTEMBER 2025 KANSAS CITY AREA MARKET UPDATE
Homes are selling for an average of 97.0% of the original list price. Days on the market is at 39 days. KC has a 2.7 months supply of homes on the market, which is 8,536 available houses.
Easy Fall Task List for Winter Home Prep
Does fall home maintenance ever seem overwhelming? This month, we're sharing an easy three-month task list that will help you get started on stress-free winter prep. Checking these items off your to-do list...