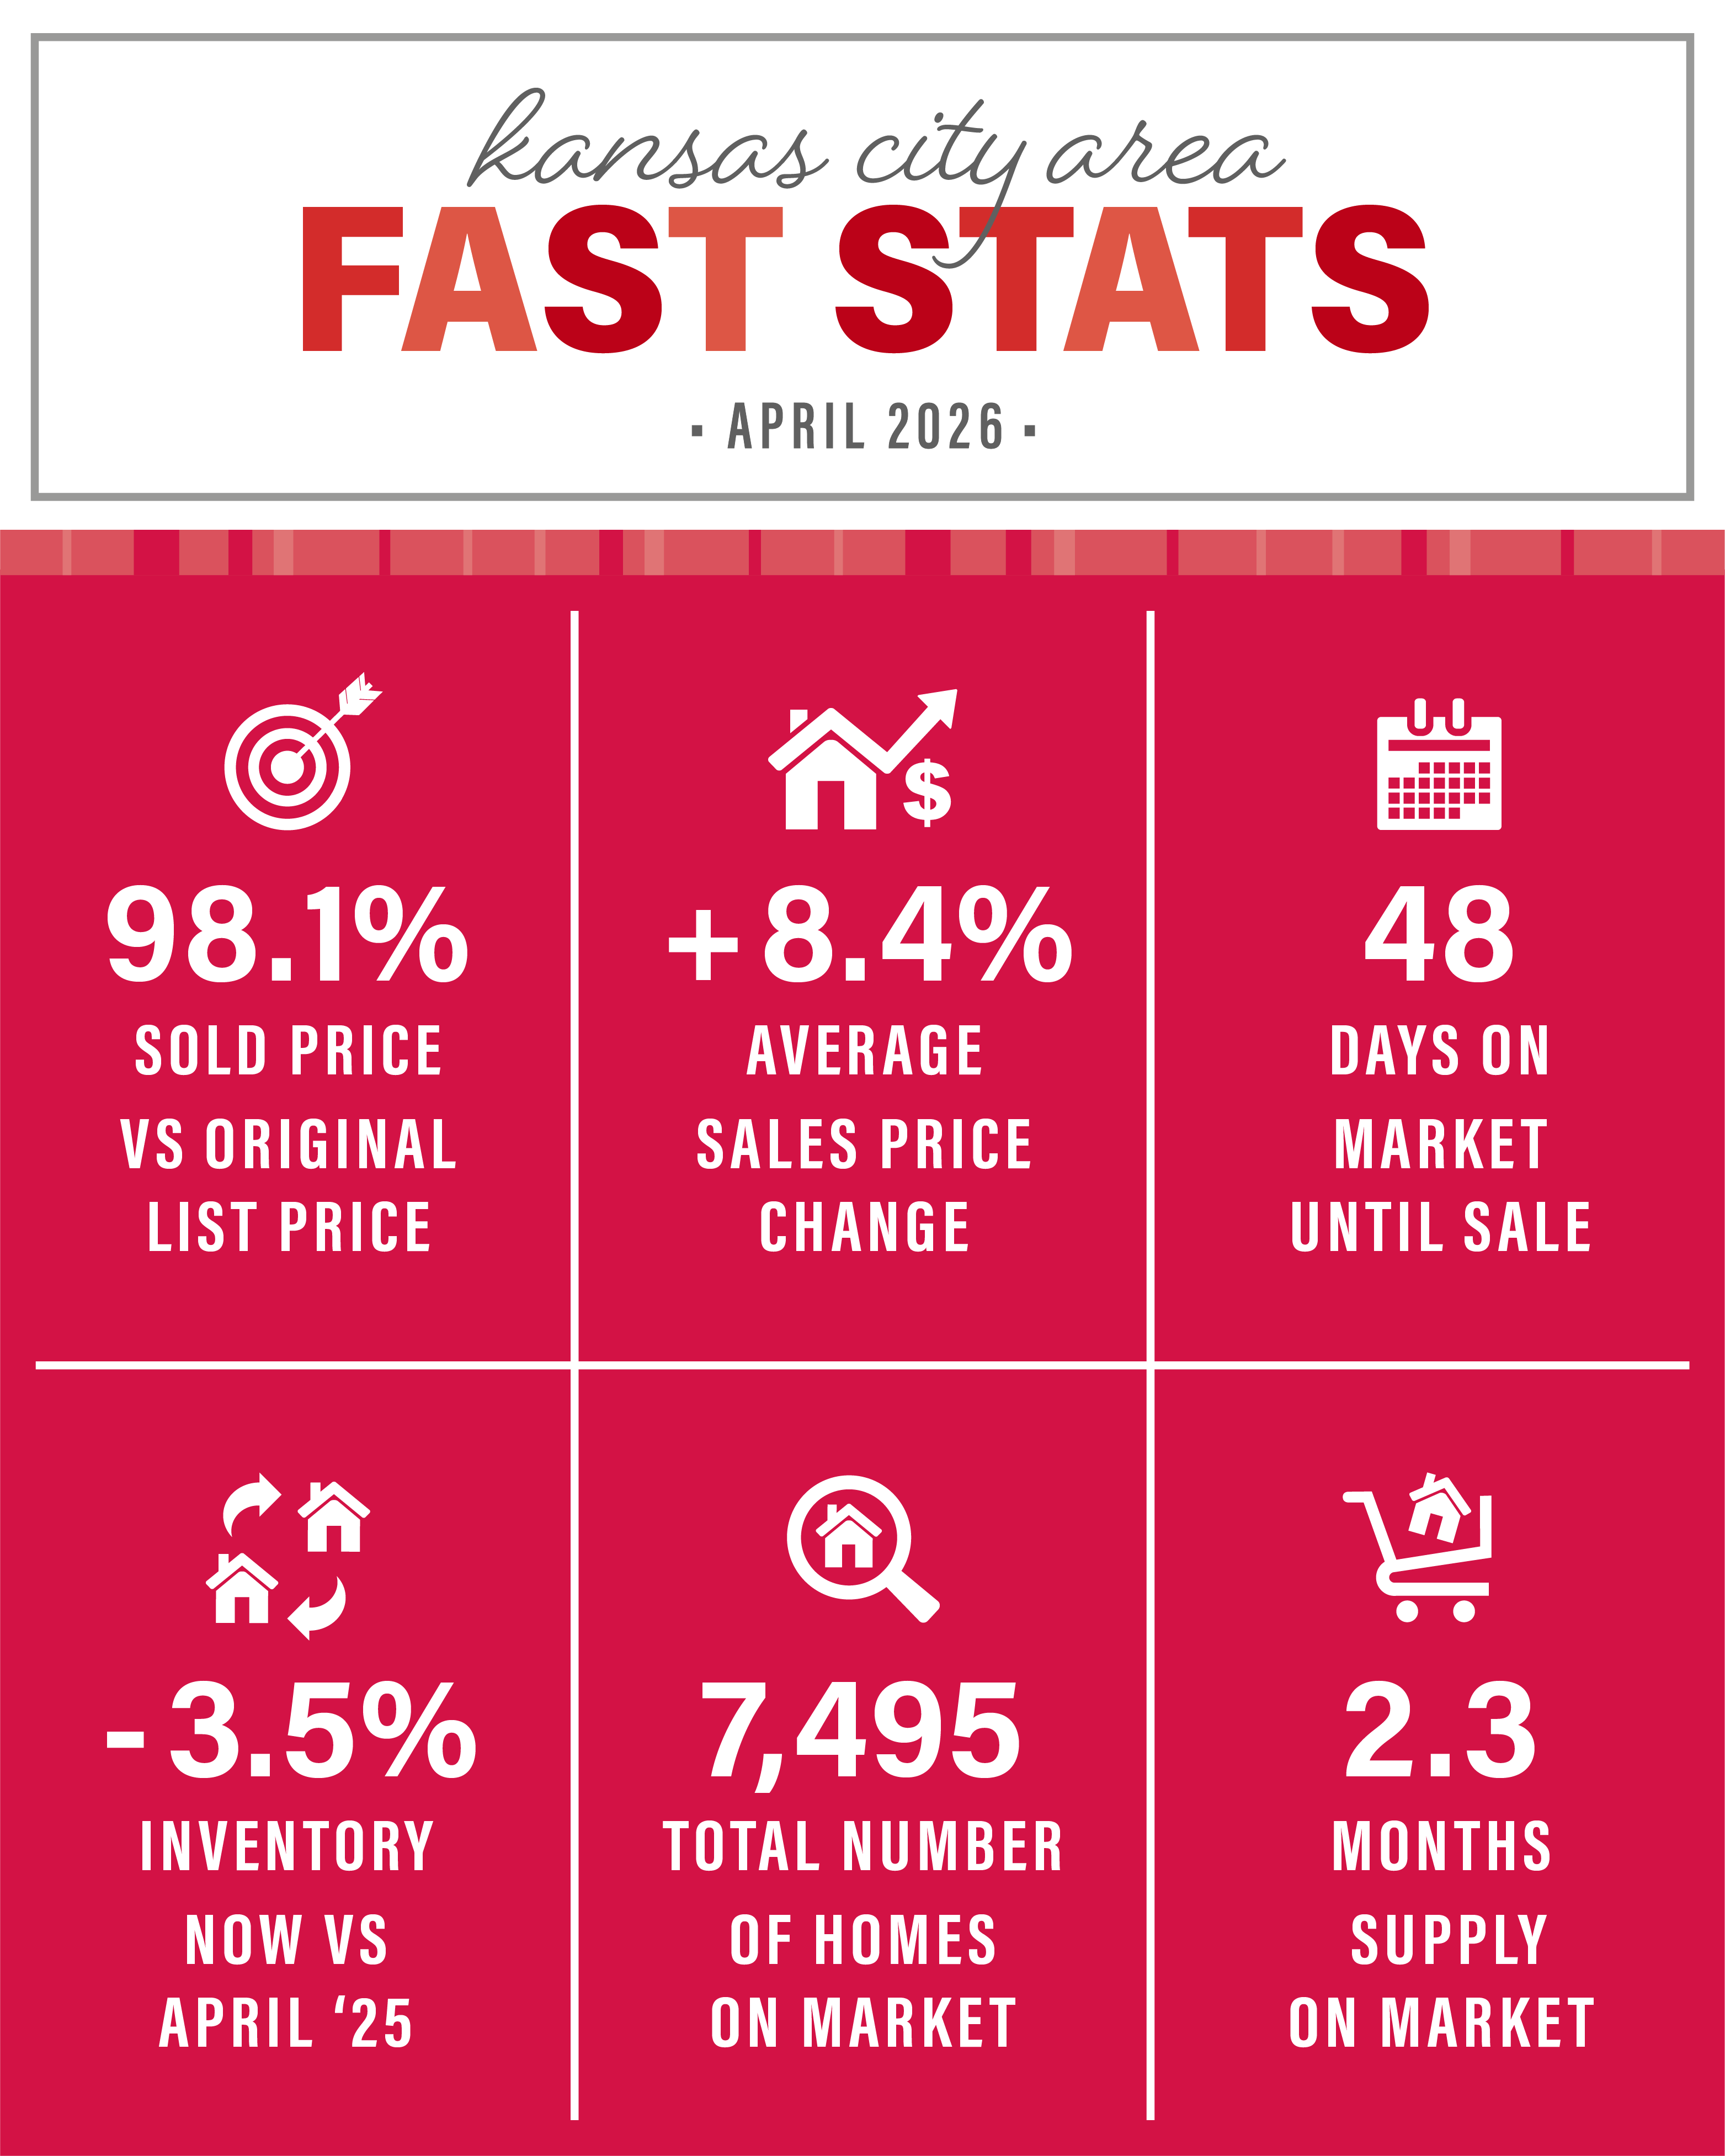
KANSAS CITY REAL ESTATE FAST STATS — APRIL 2026
Homes sold for an average of 98.1% of original list price
48 days on market on average
2.3 months of inventory, with approximately 7,495 homes available
Most areas of the Kansas City metro remain in a seller’s market, with some price points trending toward balance
Closed Sales increased 2.5 percent for Existing Homes and 7.6 percent for New Construction homes. Pending Sales decreased 4.9 percent for Existing Homes but increased 10.9 percent for New Construction homes. Inventory decreased 4.6 percent for Existing Homes but increased 1.4 percent for New Construction homes.
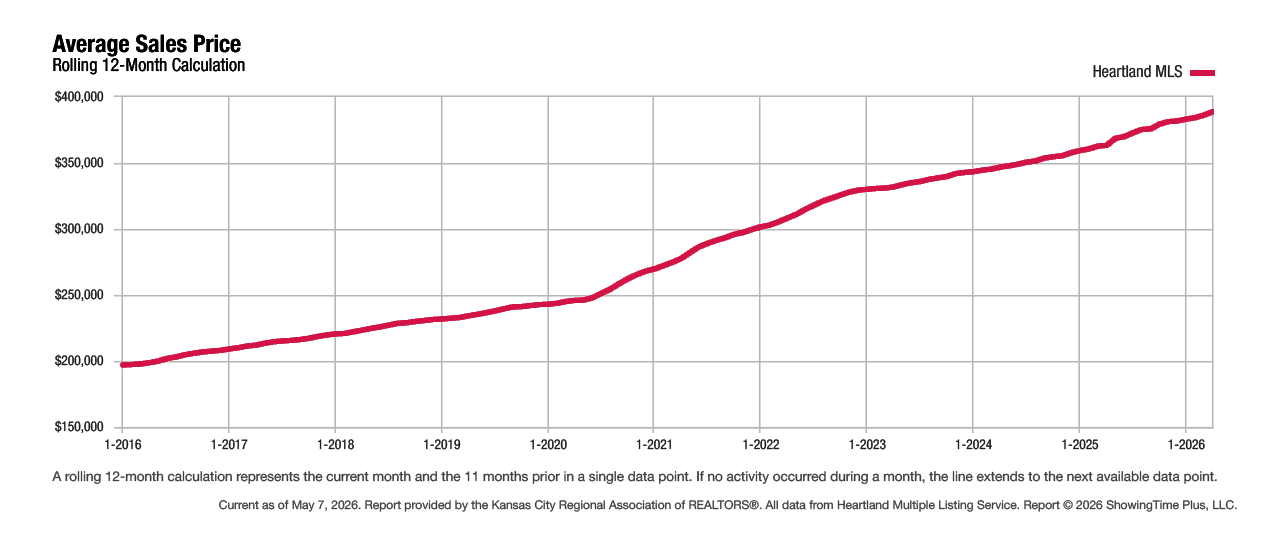
Median Sales Price increased 6.5 percent to $315,000 for Existing Homes and 10.9 percent to $543,500 for New Construction homes. Days on Market increased 11.8 percent for Existing Homes and 6.2 percent for New Construction homes. Months Supply of Inventory decreased 8.7 percent for Existing Homes and 3.8 percent for New Construction homes.
The majority of the Kansas City metro is still in a seller’s market, but not all areas are alike. Exact data varies from county to county, and for different home prices. There are now some price points and/or areas that are coming into a balanced or buyer’s market. Because market conditions vary by neighborhood and price point, local guidance matters when interpreting these trends. Email Miles Rost or Nicole Laufenberg with questions about the market in your current or future neighborhood. You can also call us at 913-451-4888.
NATIONAL NEWS
U.S. existing-home sales fell 3.6% month-over-month and 1.0% year-over-year to a seasonally adjusted annual rate of 3.98 million, according to the National Association of REALTORS® (NAR), as tight supply and ongoing affordability challenges constrained activity. Sales declined month-over-month in all four regions. Year-over-year, sales increased in the South and West but fell in the Midwest and Northeast.
Nationally, the median existing-home price rose 1.4% from a year earlier to $408,800, marking the 33rd consecutive month of year-over-year price increases as limited inventory continued to put upward pressure on prices, NAR said. There were 1.36 million homes for sale heading into April, up 2.3% from a year earlier, representing a 4.1-month supply at the current sales pace.
In the Kansas City metro area, the year-to-date average home sales price is $383,058, and the median is $324,900, which hits well below the current national median of $408,800, keeping homeownership affordable in Kansas City!
WHAT THIS MEANS FOR KANSAS CITY BUYERS AND SELLERS
While national housing trends provide useful context, Kansas City continues to stand out for relative affordability and steady demand. With the local median price remaining well below the national average, KC remains attractive for buyers, while sellers still benefit from limited inventory in many KC neighborhoods.
As always, conditions can vary significantly by location, price range, and property type — especially for luxury homes and lake communities.
All stats and information courtesy of KCRAR – the Kansas City Regional Association of Realtors®